Semrush Tutorial: The Complete Guide (2026)


Your boss drops a competitor URL into your chat and asks where their traffic is coming from, or you open Semrush for the first time and stare at dozens of modules with no idea where to click. This guide walks you through the core tools you actually need for everyday SEO and GEO work, what each number tells you, and where the estimates need a reality check.
Most available tutorials still show the 2023-era interface, skip the newer AI search modules, and say little about validating estimated metrics against real data. I use Semrush primarily for competitor benchmarking and technical site diagnostics, so this guide updates the workflow to the 2026 interface and focuses on how to verify what you see.
Key points
- In 2026, Semrush groups its tools into toolkits on the far-left rail: SEO, AI, Traffic & Market, Local, Content, Ad, AI PR and Social. For an ecommerce or DTC site, day-to-day work happens mostly in the SEO and AI toolkits.
- Domain Overview, Top Pages, Site Audit and Position Tracking now carry AI search data: AI Visibility, Cited Pages, AI Search Health, and rank tracking for ChatGPT and Gemini.
- Every traffic and ranking figure is a Semrush estimate. Use it to compare competitors and read trends, not as a substitute for your own Google Search Console (GSC) data.
- From late October 2026, Google changed how it responds to automated queries, and keyword counts and traffic estimates in Semrush dropped. Keep that in mind when reading any trend line after October.
(All screenshots reflect the live interface as of November 6, 2026, using allbirds.com in the US database, the keyword wool sneakers, and linusseo.com for project setups.)
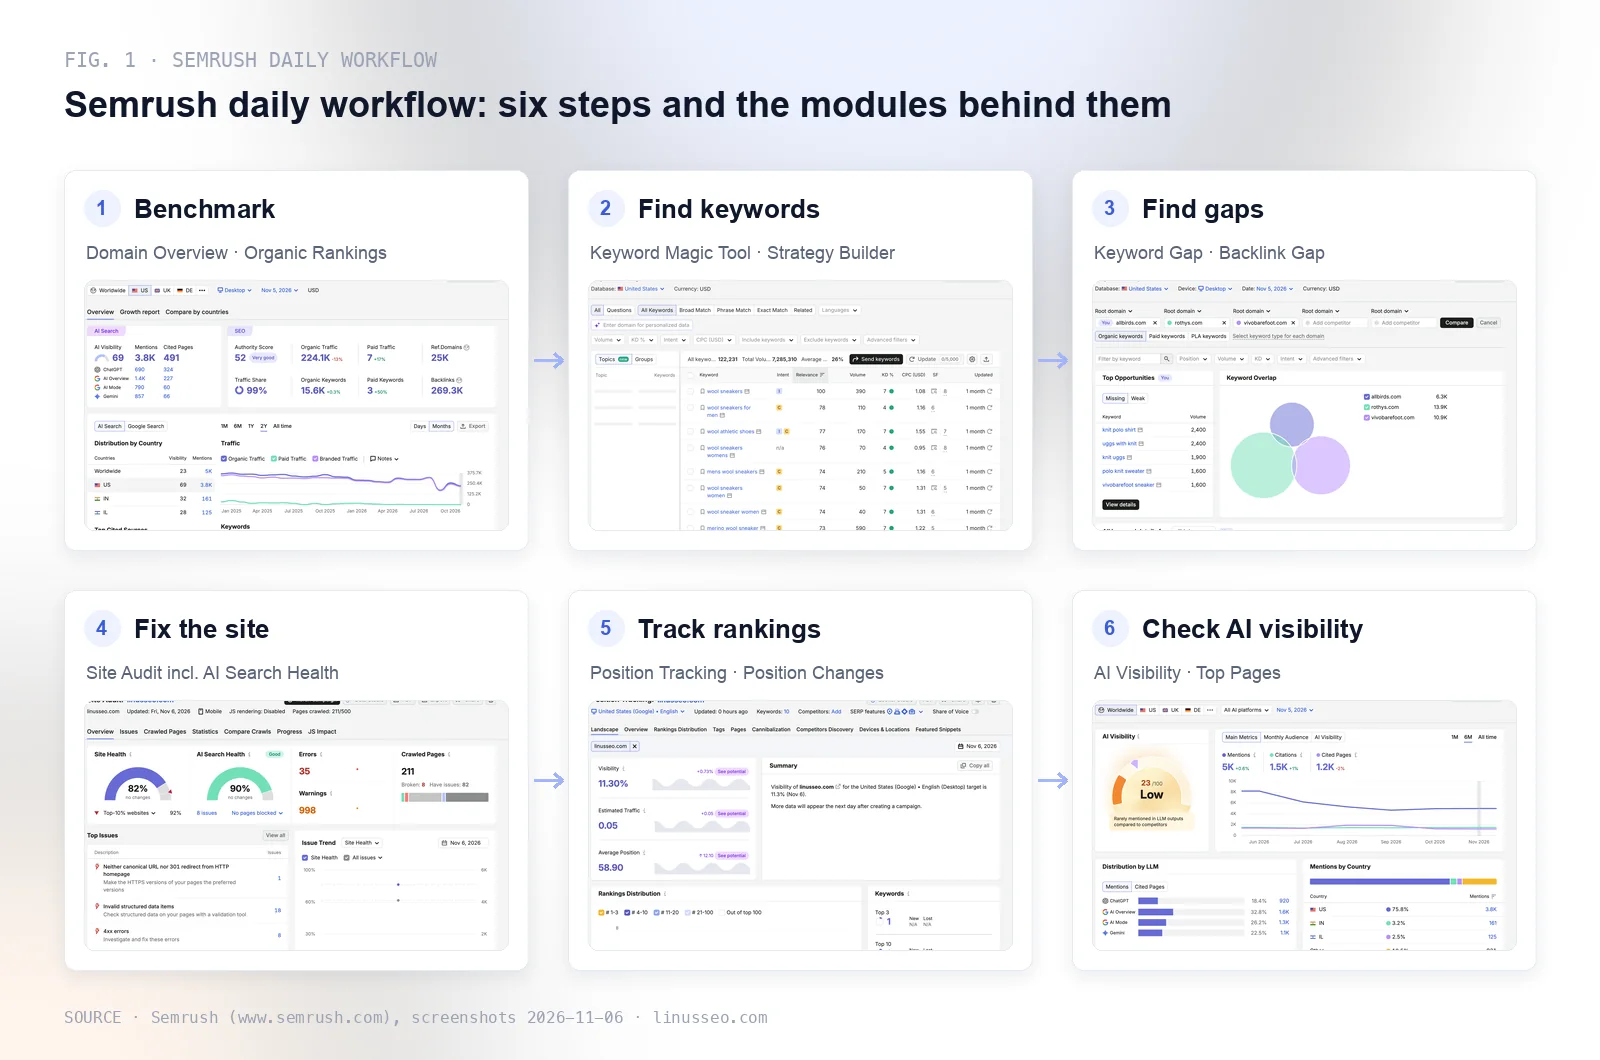
Before you start: getting around Semrush and the three settings you must check
When you log in, the column of icons on the far left shows your toolkits. Clicking one opens its modules right next to it. For SEO and GEO, the SEO toolkit is where you spend most of your time:
| Group | Modules | What it is for |
|---|---|---|
| Site Performance | Site Audit, Position Tracking | Checking and tracking your own site; requires a project |
| Competitive Analysis | Domain Overview, Organic Rankings, Top Pages, Compare Domains, Keyword Gap, Backlink Gap | Analyzing any domain, no project needed |
| Keyword Research | Keyword Overview, Keyword Magic Tool, Keyword Strategy Builder, Saved Keywords | Finding keywords and judging difficulty and intent |
| Content Ideas | SEO Writing Assistant, Topic Research, SEO Content Template | Reference while writing |
| Link Building | Backlinks, Referring Domains, Backlink Audit | Backlink research and audits |
The search bar at the top takes either a domain or a keyword. Click Analyze to jump straight into the matching overview.
Here is the first thing to watch: almost every report relies on three global controls at the top. Change any of them, and every figure on your screen shifts:
- Database (country). Semrush tracks Google rankings separately by country. If you target US buyers, choose US. The metrics you see apply strictly to that country; Worldwide sums all regional databases together.
- Device. Desktop or mobile. Most reports default to desktop, so switch explicitly whenever you want to check mobile performance.
- Date. You can pull up historical snapshots, which is useful when comparing performance before and after a Google algorithm update.
When you run a domain search, pay attention to the scope selector next to the search bar. Root Domain includes all subdomains, Subdomain restricts the view to one subdomain, Exact URL inspects a single page, and Subfolder scopes down to a directory like /blog/. When you want to pull apart a competitor’s blog or a specific collection, Subfolder is the fastest way to do it.
Domain Overview: sizing up a site in five minutes
When you look at a domain for the first time, Domain Overview answers one basic question: roughly how big is this site in Google search, and how visible is it in AI search?
Where to find it: SEO → Competitive Analysis → Domain Overview. Enter a domain and click Analyze.
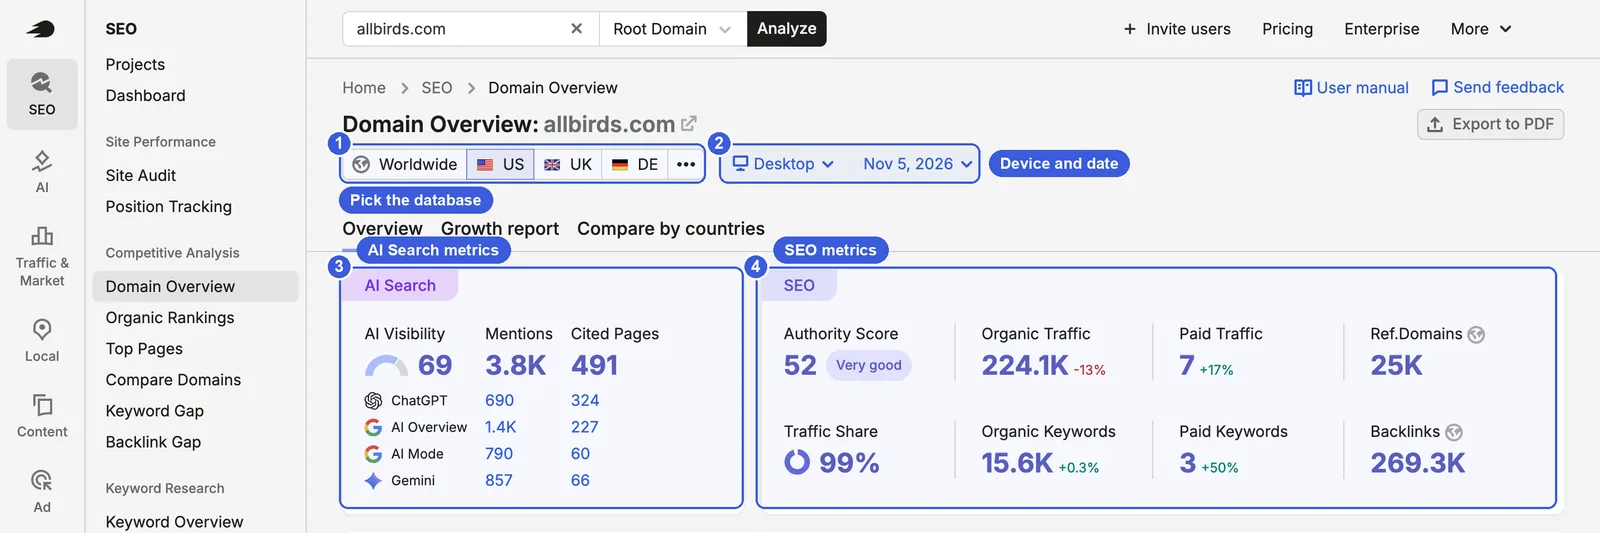
Interface and controls
- ① Database: Worldwide, US, UK, DE; click “…” to choose other regions. The screenshot uses US.
- ② Device and date: Toggle between desktop and mobile, or select a past date. The latest data date at capture time was November 5, 2026. USD on the right is the currency used for CPC and traffic value.
- ③ AI Search: A card added in 2026, placed right above the SEO metrics.
- AI Visibility: A 0–100 score calculated from how frequently AI answers mention and cite the brand. allbirds.com scores 69 in the US.
- Mentions: How many times AI responses mention the brand name (3.8K at capture time).
- Cited Pages: How many distinct pages from the domain serve as source links in AI answers (491 at capture time).
- Below, the same metrics break down across ChatGPT, AI Overview, AI Mode, and Gemini.
- ④ SEO:
- Authority Score: Semrush’s proprietary 0–100 score evaluating domain strength based on backlink quality, organic traffic, and link profile naturalness. This is not a Google metric.
- Organic Traffic: Semrush’s estimate of monthly Google organic visits (224.1K). The −13% next to it indicates the change against the previous month.
- Paid Traffic and Paid Keywords: Estimates for Google Ads activity.
- Ref.Domains and Backlinks: Summary link metrics; click either to jump into the Backlinks report.
- Organic Keywords: Number of keywords ranking in Google’s top 100 within the selected database (15.6K).
The three tabs at the top switch between Overview, Growth report, and Compare by countries. Scrolling down the Overview tab, you will find:
- Distribution by Country: AI visibility and mentions broken down by geography.
- Top Cited Sources: The domains most frequently cited in AI answers for this niche.
- Traffic and keyword trend charts.
- Google SERP Positions Distribution: The mix of result types where the domain ranks (in the screenshot, organic blue links account for 86.9% and AI Overviews make up 7.6%).
- Main competitors.
Step by step
- Type a domain into the top search bar, set the scope to Root Domain, and click Analyze.
- Switch the database to your primary target market (such as US) and leave the device on Desktop.
- Look at Organic Traffic, Organic Keywords, and Authority Score in the SEO card to get an immediate feel for domain size.
- Move to the AI Search card to check Mentions, Cited Pages, and platform splits.
- Scroll down to Top Cited Sources to see which third-party sites AI answers draw from most often.
Less obvious features
- Toggle Notes at the top right of the trend chart to overlay confirmed Google algorithm updates onto the timeline. If you see traffic swing suddenly, checking the dates here is your quickest first step.
- The AI Search / Google Search toggle on the upper left of the lower section controls whether the country breakdown and cited-sources table display AI search or traditional Google search data.
- Top Cited Sources reveals which external domains AI answers cite repeatedly in this topic space. In the screenshot, reddit.com and youtube.com follow directly behind allbirds.com.
- Export to PDF in the top right lets you generate an executive summary report for team members or clients who do not use Semrush.
How to use it for SEO
- When evaluating a new site or vetting a competitor, check the scale first. Only sites with comparable traffic, keyword volume, and Authority Score serve as true direct benchmarks.
- When organic traffic drops, pinpoint the exact month the decline began on the trend chart, then toggle Notes to see whether a core or spam update rolled out at that time.
How to use it for GEO
- Use the AI Search card to establish a brand’s baseline in AI engines. If a site has thousands of mentions but very few cited pages, AI models recognize the brand name without referencing its site; your next step is checking Top Pages to see which specific URLs actually get cited.
- Identify the third-party platforms in Top Cited Sources (like Reddit and YouTube). Those are the places your GEO work should aim to appear.
Caveats on the data
- Organic Traffic is purely an estimate. Semrush models it from keyword rankings, estimated search volume, and standard CTR curves; it is never your real server traffic. For your own clicks, GSC remains your sole source of truth.
- AI visibility shifts drastically by country. allbirds.com scores 69 in the US database, but only 23 Worldwide in the AI Visibility toolkit. Always verify that you are looking at the same region before comparing numbers.
In practice, the divergence is typically widest in two scenarios: sites driven heavily by niche long-tail queries that are absent from third-party databases, and keywords that trigger zero-click SERP features or heavy brand navigation where standard CTR models fail to reflect actual clicks.
Organic Rankings: seeing which keywords actually bring traffic
Organic Rankings reveals every keyword a site ranks for on Google and shows you which specific queries drive their organic visits. (Earlier versions of Semrush called this report Organic Research.)
Where to find it: SEO → Competitive Analysis → Organic Rankings, or click the Organic Keywords count inside Domain Overview.
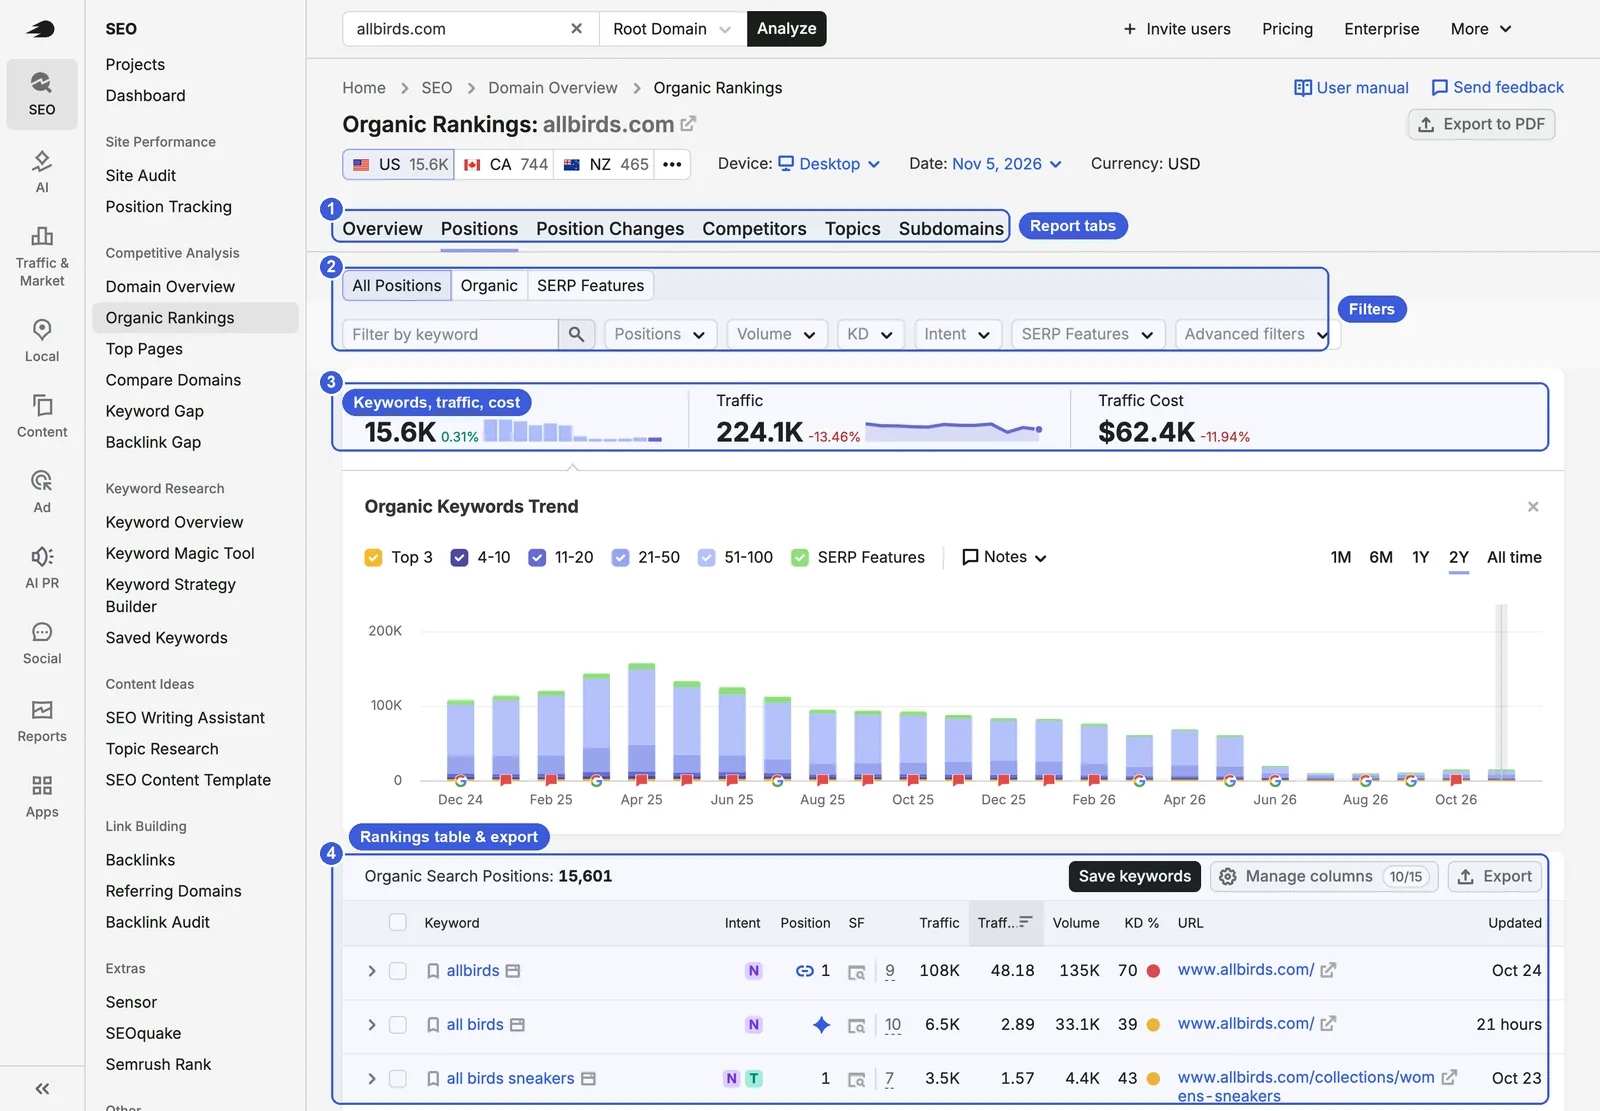
Interface and controls
① Report tabs:
- Overview: High-level trend charts.
- Positions: The full, granular keyword ranking list (the tab you will work in most often).
- Position Changes: Keywords that recently climbed, dropped, appeared, or vanished (covered in detail in the next section).
- Competitors: Sites targeting an overlapping set of search terms.
- Topics: Keywords clustered by theme.
- Subdomains: Traffic distribution across different subdomains.
② Filters:
- All Positions / Organic / SERP Features: Switch between the full ranking set, standard organic blue links, or special SERP elements like featured snippets and AI Overviews.
- Filter by keyword: Search for specific words or terms within the keyword list.
- Positions, Volume, KD, Intent, and SERP Features: Quick dropdown filters. KD (Keyword Difficulty) is Semrush’s 0–100% estimate of how hard it is to reach page one. Intent indicates what the searcher wants to accomplish (informational, navigational, commercial, or transactional). SERP Features highlight non-standard listings such as shopping carousels, snippets, and AI Overviews.
- Advanced filters: Combine custom rules, such as “URL contains
/collections/“ combined with “Position 4–20”.
③ Headline metrics: Keywords (15.6K), Traffic (224.1K), and Traffic Cost ($62.4K). Traffic Cost estimates what buying the equivalent traffic via Google Ads would cost each month. The bar chart below tracks ranking counts over time, colored by ranking bracket (top 3, 4–10, 11–20, etc.).
④ Rankings table: One search term per row. Core columns include:
- Intent: I (informational), N (navigational), C (commercial), T (transactional).
- Position: Where the domain ranks for the query.
- SF: Which SERP features appear on that search result page.
- Traffic and Traffic %: Estimated visits driven by this keyword and its percentage share of total site traffic.
- Volume, KD %, URL (the specific landing page), and Updated date.
Above the table, Save keywords sends marked rows into a list, Manage columns customizes your view, and Export outputs to CSV or Excel.
Step by step
- Open Organic Rankings; you land directly on the Positions tab.
- Open Advanced filters, select Exclude, and filter out queries containing the brand name (such as allbirds).
- Sort the table by Traffic descending to inspect the top 50 non-branded terms driving visits.
- Review the ranking URL for each top keyword to see whether competitor traffic lands primarily on the homepage, category collections (
/collections/), or informational blog articles.
Less obvious features
- Quick-win opportunities: Filter Position to 11–20 and sort by Volume. These terms already sit on page two; updating content or adding internal links to those pages can often push them onto page one.
- Isolating collection pages: In Advanced filters, add “URL contains
/collections/“ to analyze Shopify category pages alone. Use/blogs/or/blog/to examine content marketing performance. - Branded vs. non-branded split: In the screenshot, the top traffic drivers are branded terms (allbirds, all birds). Excluding brand queries as shown in step 2 tells you how much traffic comes from genuine unbranded demand.
How to use it for SEO
- When analyzing a rival site, sort by estimated traffic and go through their top 50 non-branded queries. Check whether your own site has a dedicated, well-optimized page targeting each of those topics.
- Filter Intent to Commercial and Transactional to locate purchase-intent keywords that can lead directly to inquiries or product sales.
How to use it for GEO
- In the SERP Features filter, select AI Overview to pull all ranking queries that trigger an AI summary. The AI Overview takes some of the clicks on these keywords, so make the content easy for AI to quote: lead with a direct answer, followed by clear definitions, specifications, and comparison tables.
Caveats on the data
- The report only captures keywords indexed in Semrush’s database. Hyper-specific long-tail queries and fresh conversational searches are frequently absent, so the total keyword count here is almost always lower than what you see in GSC.
- If you notice keyword counts and traffic dipping broadly starting from late October 2026, keep in mind that Google modified how it responds to automated crawlers around that time, as discussed in the final section of this guide.
Position Changes: your first stop after an algorithm update
Position Changes helps you spot recent ranking movements across individual keywords and entire site sections.
Where to find it: The Position Changes tab inside Organic Rankings.
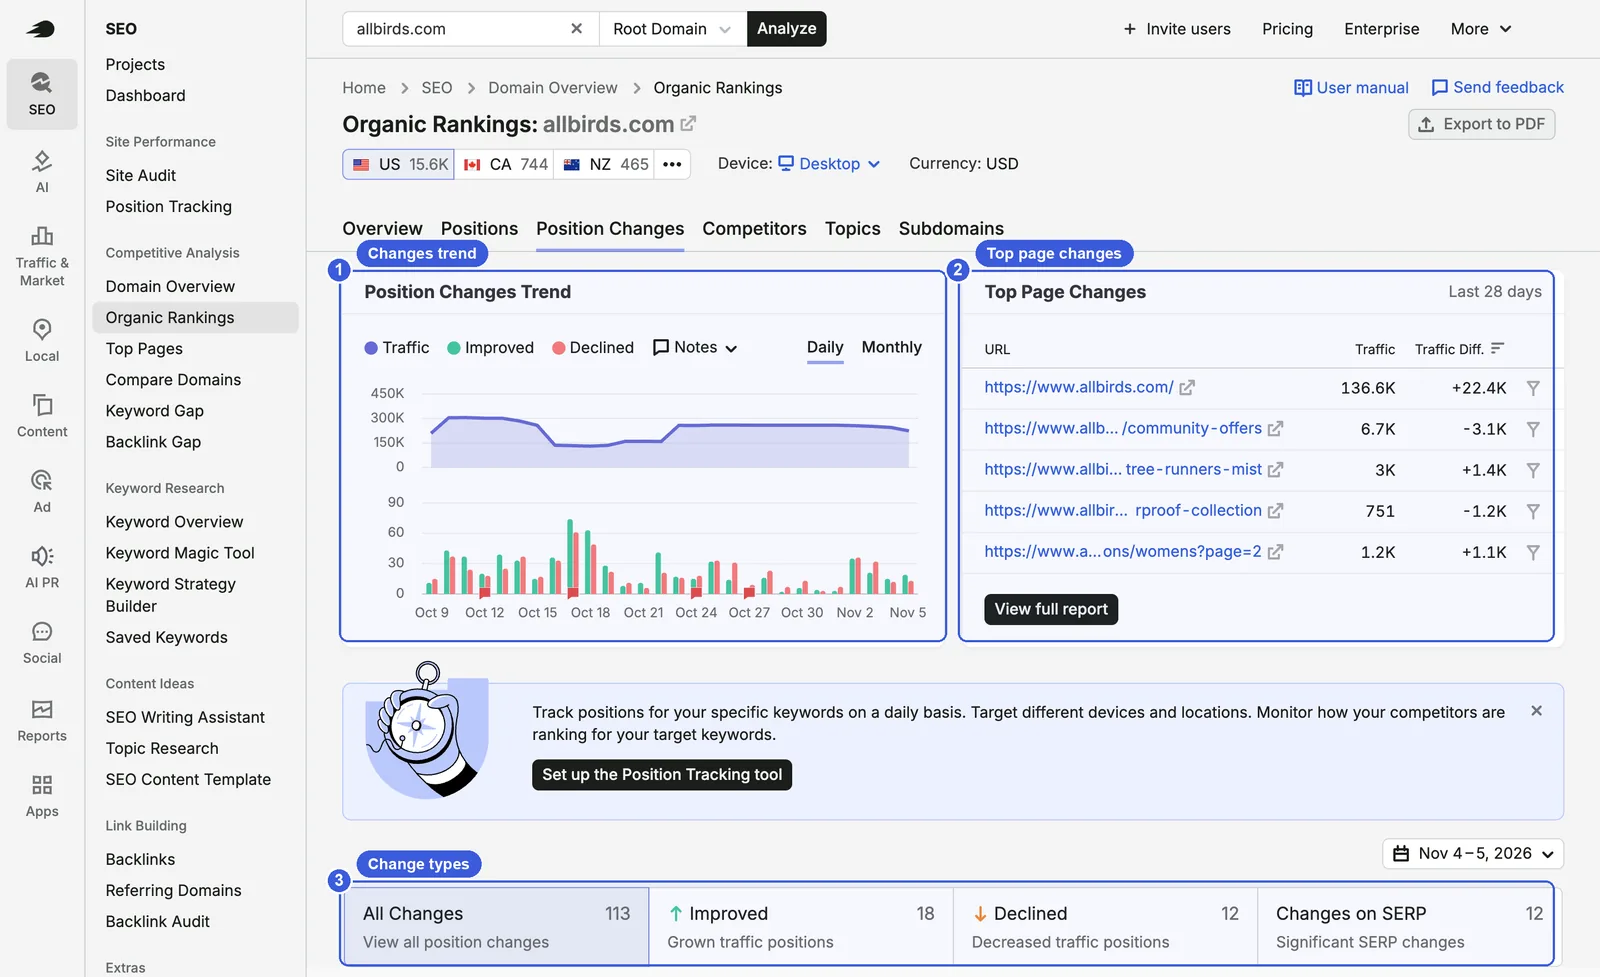
Interface and controls
- ① Position Changes Trend: Combines estimated traffic with daily counts of improved (green) and declined (red) rankings. Toggle between Daily and Monthly views at the top right.
- ② Top Page Changes: Highlights pages experiencing the largest traffic swings over the past 28 days, showing the net gain or loss under Traffic Diff. Click View full report to inspect all URLs.
- ③ Change types: All Changes, Improved, Declined, and Changes on SERP. In the screenshot, allbirds.com logged 113 changes (18 improved, 12 declined). Selecting a type filters the table below accordingly. The date selector on the right controls which two dates are compared.
Step by step
- Switch to the Position Changes tab and set the date picker to compare two points in time.
- Click Declined to display only terms that lost positions.
- Look at Top Page Changes first to see which URLs shed the most traffic over the 28-day window, then examine the URLs of the dropped terms to determine if the loss is sitewide or isolated to a single folder.
- For core keywords with steep drops, search them in Google to identify which competitors moved ahead of you.
Less obvious features
- Changes on SERP isolates search queries where the layout of the search results shifted significantly, such as an AI Overview or featured snippet appearing or disappearing. When your ranking positions remain steady but organic clicks drop, check this tab first.
How to use it for SEO
- When Google confirms a core or spam update, adjust the comparison dates to just before the rollout began and just after it settled. Inspect which of your pages dropped and compare them against competitors. If drops cluster within a specific page template (such as blog posts or collection pages), the underlying issue usually relates to site architecture or content patterns common to that template.
Caveats on the data
- Semrush does not re-crawl every single keyword on a daily cycle; update frequency varies by search volume. A one-day fluctuation on an individual keyword is rarely meaningful; look instead at the 7-to-14-day trend across an entire page category.
Top Pages: finding where traffic concentrates and what AI quotes
Top Pages shows you which specific pages pull in the bulk of a domain’s traffic, and which pages generative AI models quote most often.
Where to find it: SEO → Competitive Analysis → Top Pages.
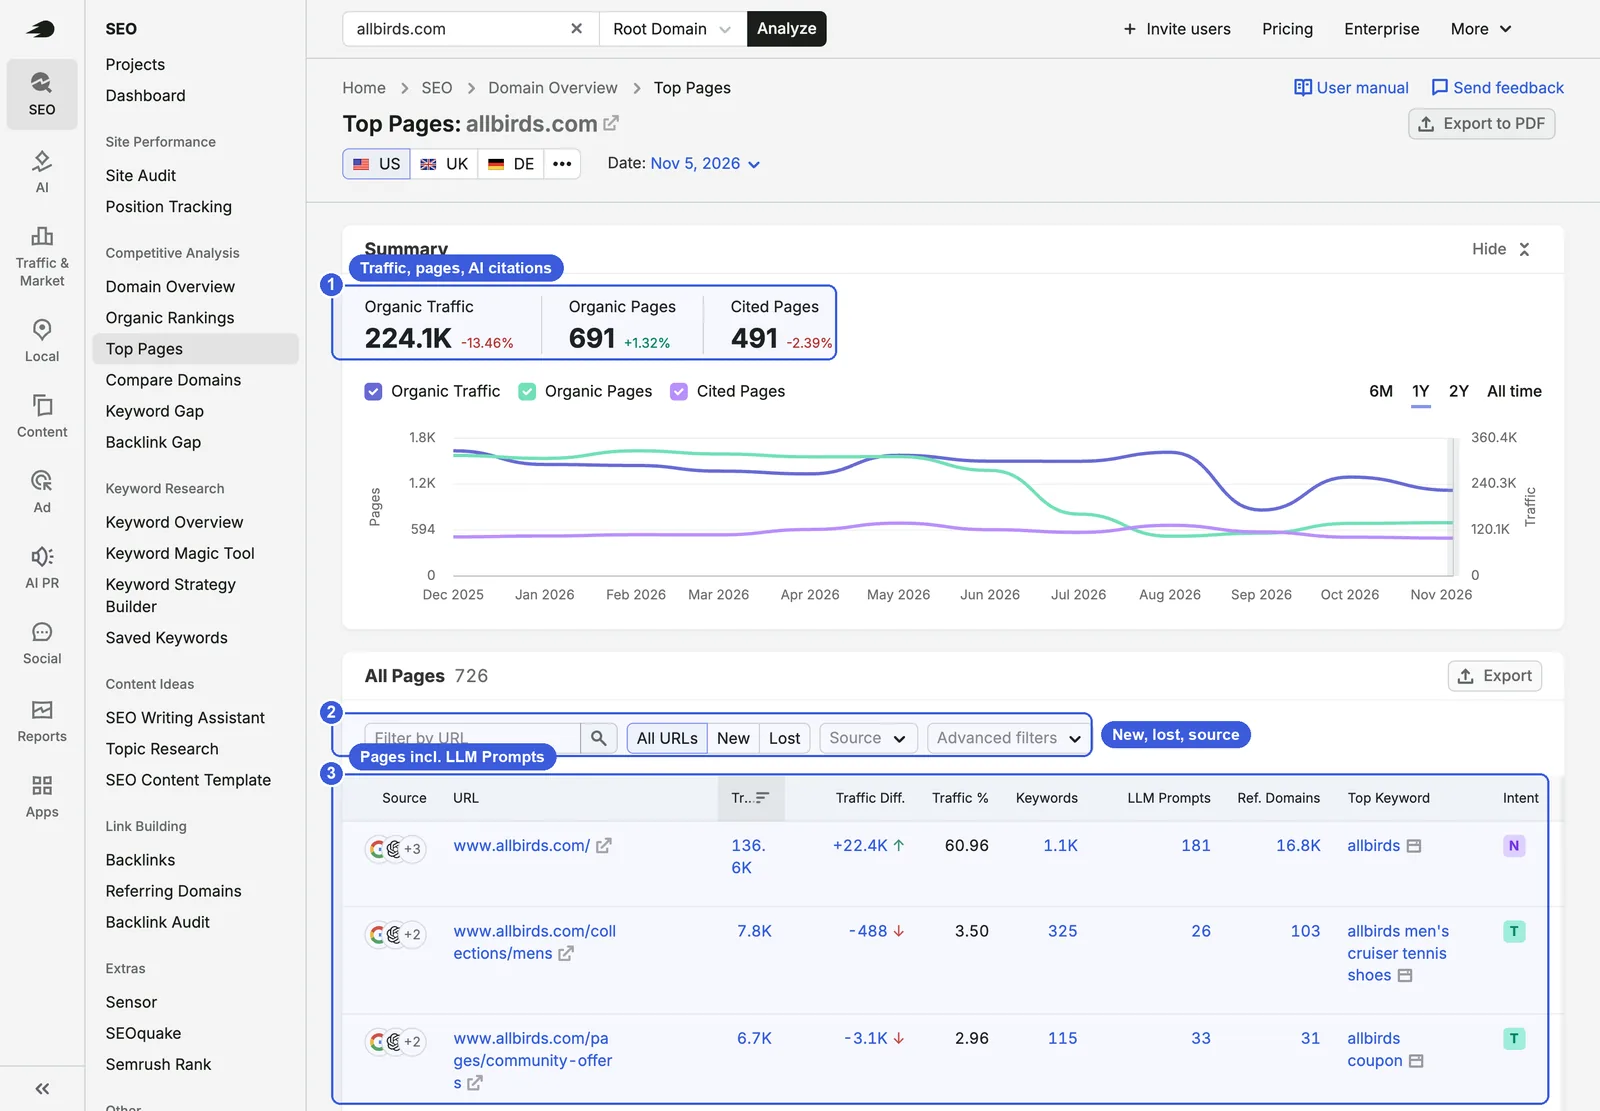
Interface and controls
- ① Summary: Displays Organic Traffic (224.1K), Organic Pages with active rankings (691), and Cited Pages referenced by AI models (491), with historical trend lines for all three.
- ② Filters:
- All URLs / New / Lost: View all pages, pages that started ranking recently, or pages that dropped out of the top 100.
- Source: Filter pages based on whether their visibility originates from Google search or AI search engines.
- Advanced filters: Filter by specific URL paths, traffic thresholds, or keyword counts.
- ③ Page table: One URL per row. Key columns include:
- Source: Platform icons indicating where the page appears (“+3” shows additional platforms).
- Traffic, Traffic Diff., and Traffic %.
- Keywords: Total ranking terms for the page.
- LLM Prompts: Count of AI prompt answers referencing this page.
- Ref. Domains, Top Keyword, and Intent.
Step by step
- Open Top Pages and ensure the database matches your target market.
- Sum the Traffic % column across the top 10 URLs to see how heavily traffic concentrates on a few key pages.
- Click New to identify URLs where your competitor recently earned fresh rankings.
- Switch back to All URLs and sort descending by LLM Prompts to locate the pages AI models cite most frequently.
Less obvious features
- Review Lost pages periodically. If your own domain shows many lost URLs, verify whether those pages were accidentally deleted, redirected, or tagged with a noindex directive.
- Use Advanced filters with “URL contains
/products/“ to inspect traffic and AI citation volumes specifically across individual product pages.
How to use it for SEO
- A competitor’s traffic usually sits on a handful of pages. Categorize the top 20 URLs by type (homepage, collection, individual product, blog post) to see its traffic structure.
How to use it for GEO
- Compare the Keywords and LLM Prompts columns. When you spot a page ranking for relatively few keywords but racking up a high LLM Prompts count, AI models are quoting it for reasons beyond pure Google ranking strength. Study that page’s structure—its direct definitions, comparison matrices, and FAQ layout—to understand why AI treats it as a factual source.
Caveats on the data
- Cited Pages and LLM Prompts reflect Semrush’s sampled prompt database. Treat these counts as relative indicators of AI visibility and competitor comparison, not an exhaustive audit of every response generated across the web.
Keyword Overview: deciding whether a keyword is worth your time
Keyword Overview helps you assess whether a specific search term is worth building content for by showing search volume, ranking difficulty, and searcher intent.
Where to find it: SEO → Keyword Research → Keyword Overview, or type any term into the top search bar.
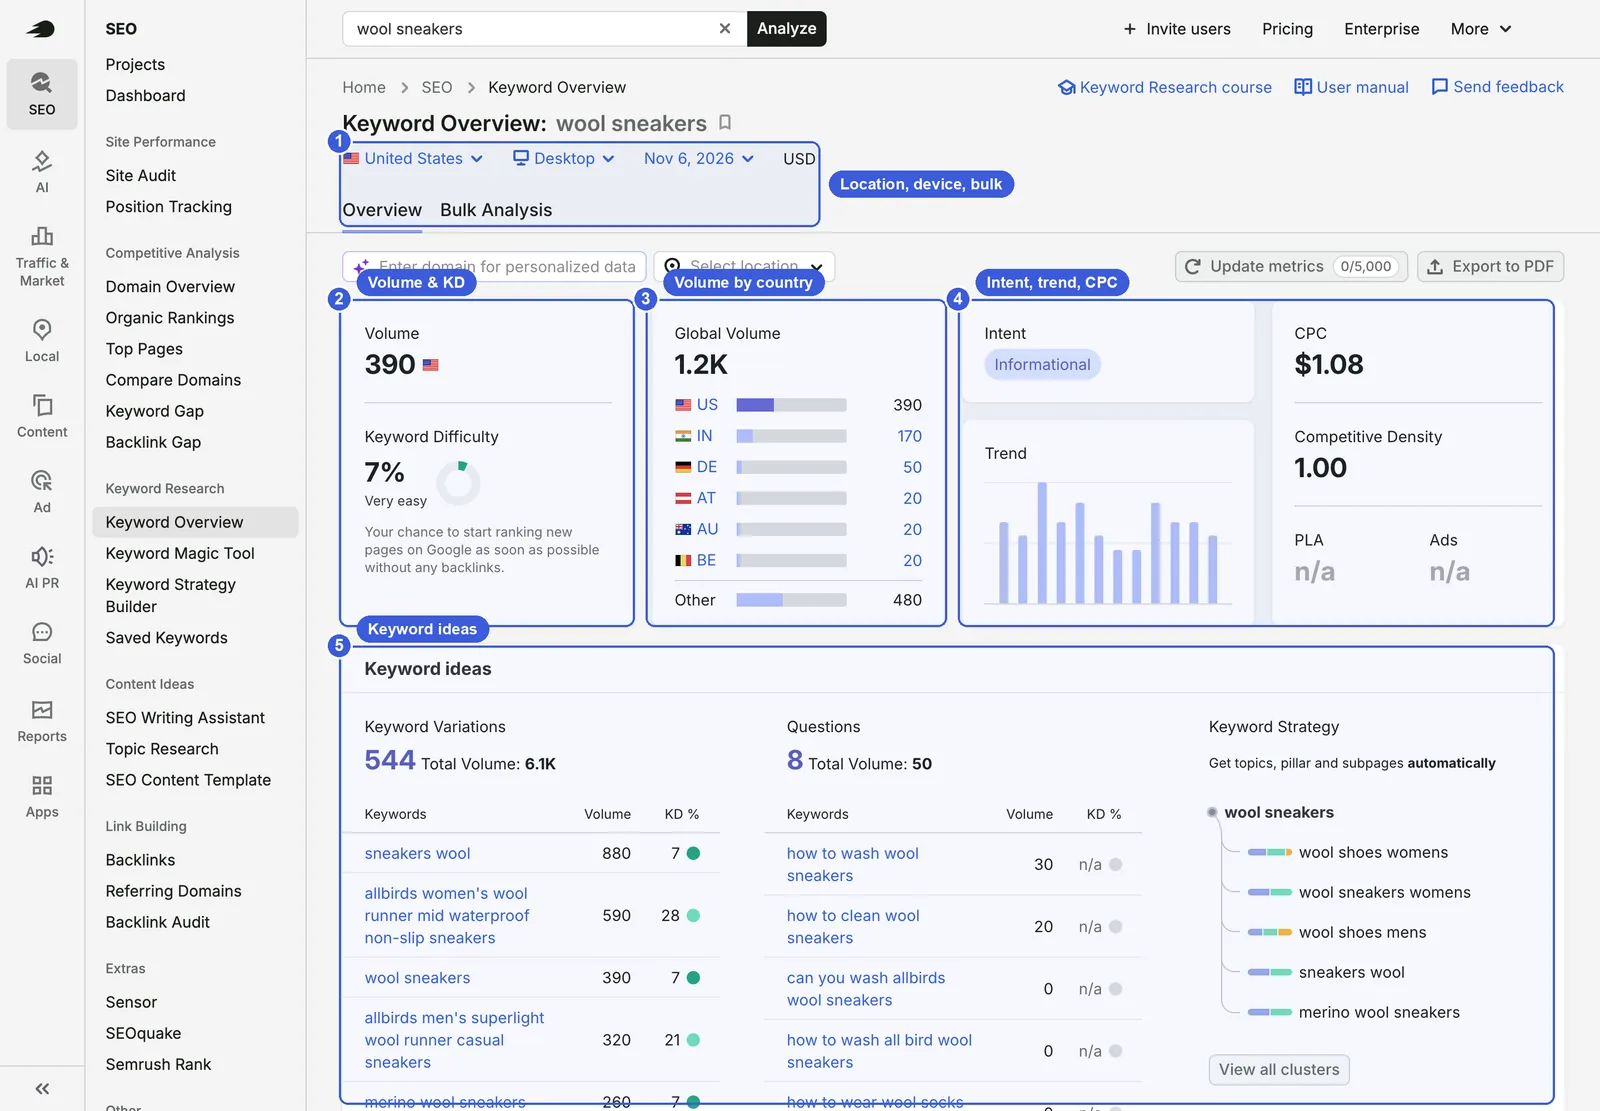
Interface and controls
- ① Location, device and bulk analysis: Country, device, and historical date. The Bulk Analysis tab processes a list of keywords together. The domain input below lets Semrush tailor difficulty scores to your site. Update metrics on the right refreshes ranking data (0/5,000 indicates used versus remaining daily credits).
- ② Volume and difficulty:
- Volume: Average monthly searches in the selected country (390 for wool sneakers in the US).
- Keyword Difficulty (KD): A 0–100% scale indicating how challenging it is to crack page one. wool sneakers sits at 7% (Very easy), noting that newer pages can rank without an extensive backlink profile.
- ③ Global Volume: 1.2K searches across all markets, with regional breakdowns for the US, India, Germany, and others. If you manage international stores, check this breakdown first to prioritize which country store to optimize.
- ④ Intent, trend and CPC:
- Intent: Categorized as Informational for this term.
- Trend: 12-month search volume trajectory, revealing seasonal spikes or dips.
- CPC and Competitive Density: Average Google Ads cost per click and advertiser competition density (0–1).
- PLA and Ads: Indicates presence of shopping ads and paid search ads (both marked n/a in the screenshot).
- ⑤ Keyword ideas:
- Keyword Variations: Related phrasing containing the seed term (544 variations totaling 6.1K combined volume).
- Questions: Question-based searches (8 identified).
- Keyword Strategy: Automatic clustering of related terms; clicking View all clusters opens Keyword Strategy Builder.
Step by step
- Enter your search term (such as wool sneakers) and select your target country.
- Review Volume and Global Volume to confirm there is sufficient market interest.
- Verify that the query’s Intent aligns with the page type you plan to create: informational queries belong on blog posts or guides; commercial and transactional terms fit collection or product pages.
- Scroll down to the SERP Analysis section and compare the Page AS (Page Authority Score) and backlink counts of the current top 10 ranking URLs against your own site metrics to gauge realistic ranking feasibility.
Less obvious features
- The Questions tab gives you ready-made questions for FAQ sections and H2 subheadings. These queries also closely mirror how searchers formulate prompts inside AI search tools.
How to use it for GEO
- Use the Questions module to see the exact phrasing people use when asking questions about the topic. Build an FAQ section around those questions and provide a clear, definitive answer in the first sentence of each response so AI engines can extract it easily.
How to use it for SEO
- Always evaluate three factors simultaneously: whether user intent matches your target page format, whether the KD score is realistically attainable given your domain’s Authority Score, and whether search volume is steady or heavily seasonal.
Caveats on the data
- KD relies primarily on the backlink strength and authority of current page-one results, without factoring in content depth or brand equity. For keywords dominated by established household brands, KD can look deceptively low while remaining difficult for a newer site to penetrate. Use KD primarily to compare difficulty among keywords within the same topical bucket.
Keyword Magic Tool: expanding a single seed into a full keyword list
Keyword Magic Tool takes one seed keyword and branches out into thousands of related search variations and long-tail phrases.
Where to find it: SEO → Keyword Research → Keyword Magic Tool.
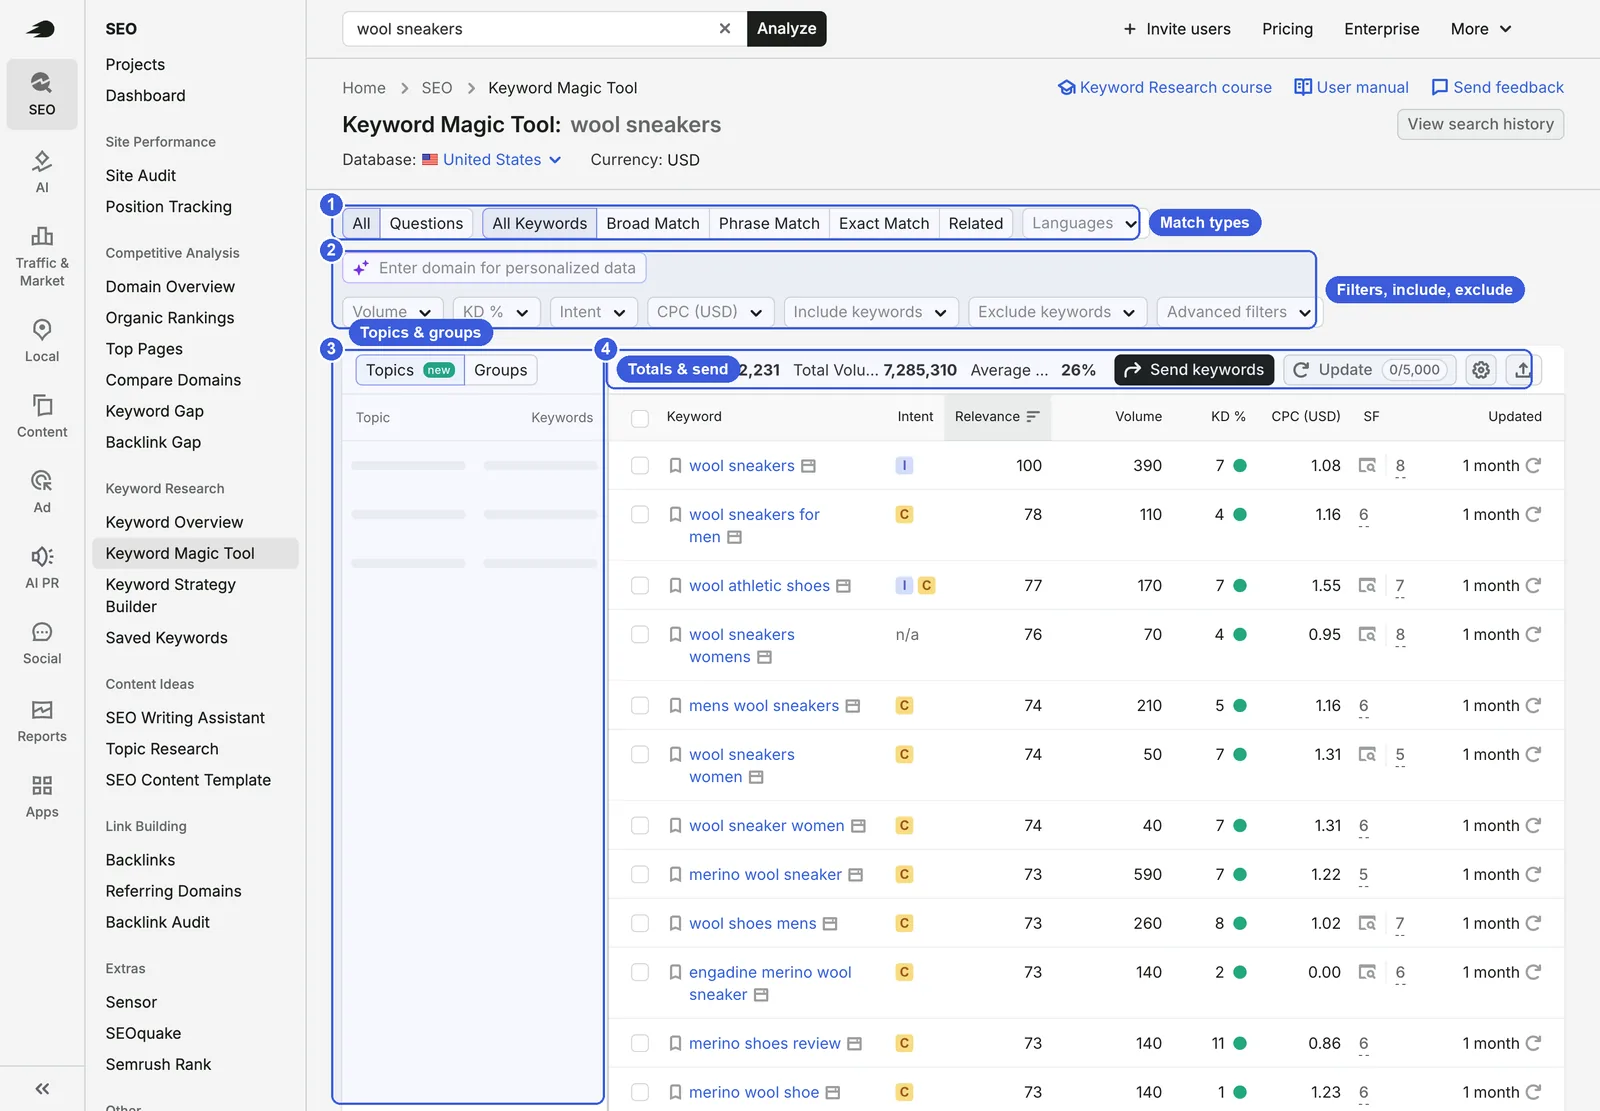
Interface and controls
① Match types:
- All / Questions: Questions filters exclusively for question formats.
- Broad Match: Any variation of the seed words in any order.
- Phrase Match: Retains the exact phrase with words in that order.
- Exact Match: Matches the exact query without extra words.
- Related: Conceptually related terms that may not contain the original seed words.
- Languages: Filters queries by language.
I usually start with Broad Match to see the full scope of queries, then switch to Phrase Match if the list contains too much noise.
② Filters: Volume, KD %, Intent, CPC, alongside Include keywords, Exclude keywords, and Advanced filters.
③ Topics and Groups: The left sidebar clusters keywords into topical groups. Clicking any group filters the main table to display only terms belonging to that cluster.
④ Totals and send:
- Totals: Broad match for wool sneakers generates 122,231 keywords, 7,285,310 total search volume, and an average KD of 26%.
- Send keywords transfers selected rows into Keyword Strategy Builder or an exported keyword list.
- Update refreshes current ranking metrics, and the icon on the right handles export.
Step by step
- Input your seed keyword and pick your target database.
- Begin with Broad Match to review all opportunities, then use Exclude keywords to strip out competitor brands (like allbirds) and irrelevant product categories (like socks).
- Filter Intent to Commercial (C) and Transactional (T), and set KD % to 30 or below for manageable targets.
- Select relevant keywords and click Send keywords to pass them to Keyword Strategy Builder, or download the set via the export icon.
Less obvious features
- Add terms like men, women, or kids into Include keywords to segment your keyword list by target audience in seconds.
- The Groups sidebar organizes queries by shared vocabulary. Often, one group maps cleanly to one collection page or blog post, making site architecture planning straightforward.
How to use it for SEO
- Prior to launching a new product collection, generate the complete keyword list, filter for KD ≤ 30 with commercial or transactional intent, and assign the resulting keyword clusters directly to specific collection pages and subcategories.
How to use it for GEO
- Queries in the Questions tab closely reflect how users query ChatGPT or Perplexity. Turn the highest-volume questions into standalone FAQ articles or sections, ensuring the first sentence answers the core question directly.
Caveats on the data
- Volume numbers represent monthly averages. For seasonal goods, refer back to Keyword Overview to review the 12-month distribution curve.
- The Related match type pulls in the broadest set of terms, and relevance drops off as you scroll down. Sort by Relevance and stick to the top listings.
Keyword Strategy Builder: mapping out topic clusters automatically
Keyword Strategy Builder groups large keyword sets into structured topic clusters and landing page blueprints. (Older versions called this Keyword Manager, and you will still see keywordmanager in the URL.)
Where to find it: SEO → Keyword Research → Keyword Strategy Builder.
Interface and controls
- Two operational modes at the top:
- Domain-Based (beta): Enter your site URL; Semrush audits existing pages, recommending which to update and what new topics to add.
- Seed Keyword-Based: Enter one or several seed terms, and Semrush constructs topics and keyword clusters from scratch.
- Select your target country and click Create. The counter on the button (0/50 in the screenshot) tracks your used versus allocated strategy credits.
- Building the strategy takes several minutes as the tool progresses through five distinct analysis steps (evaluating SERP overlap, mapping synonyms, and organizing clusters).
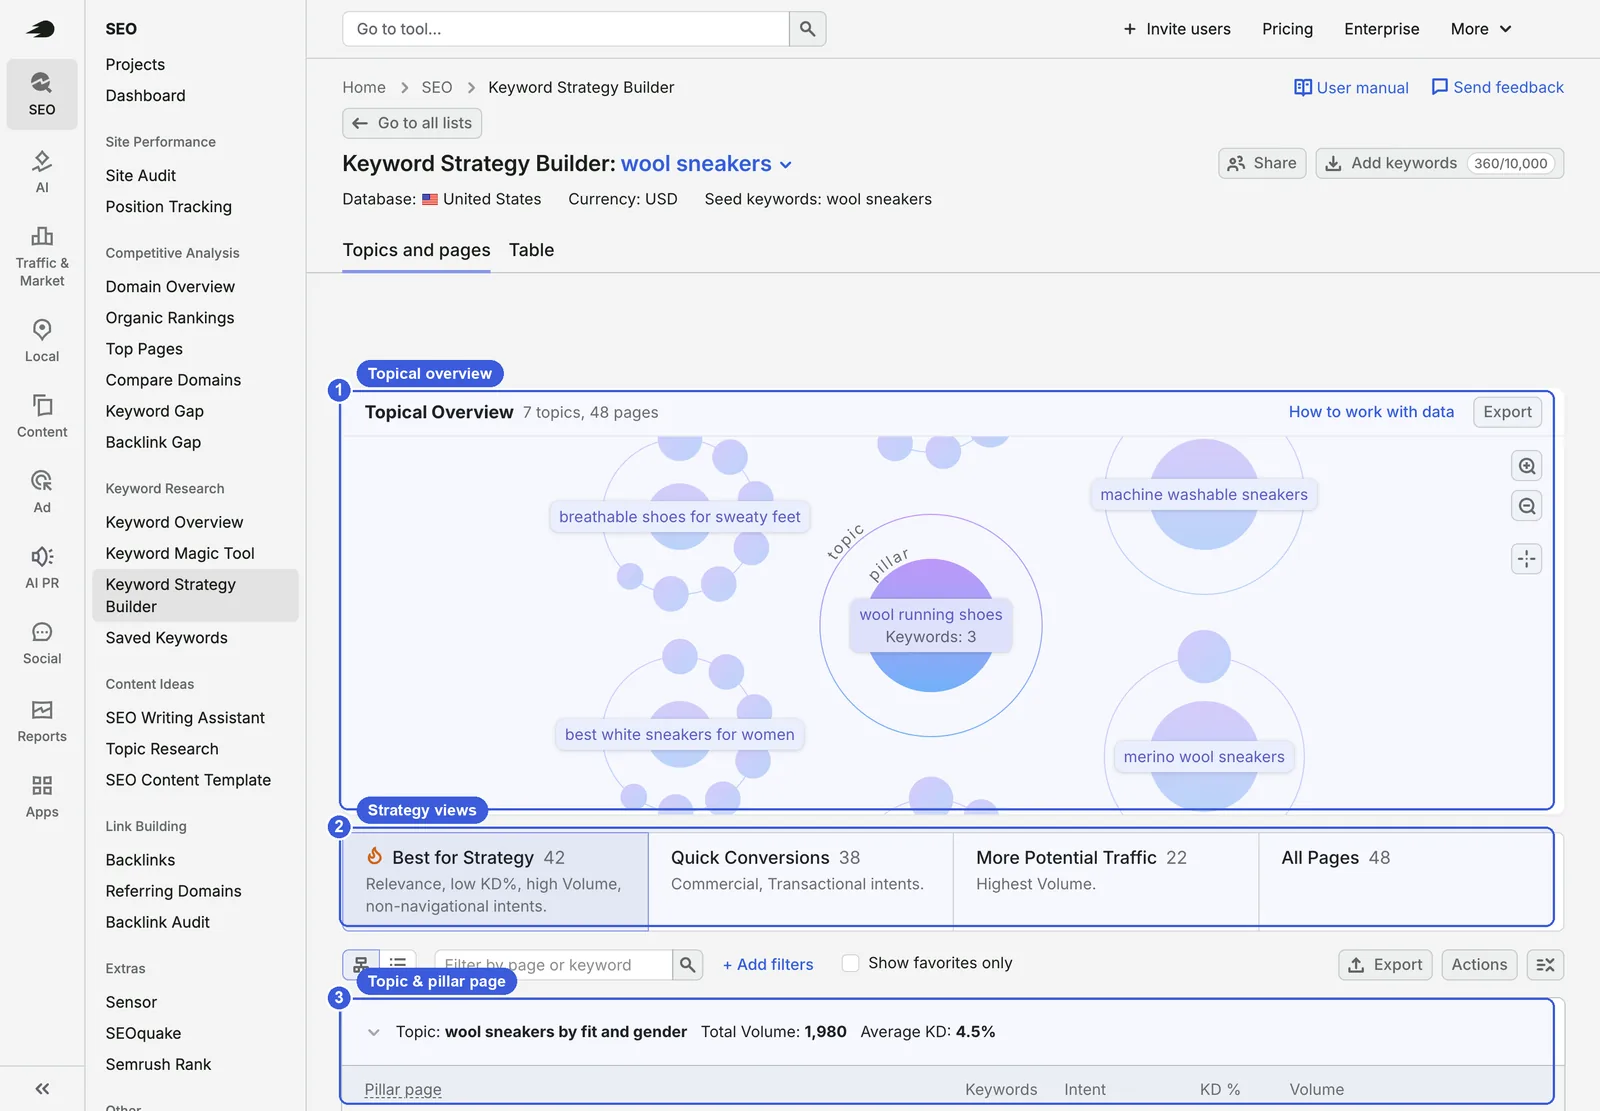
- The output screen (yielding 7 topics and 48 pages for wool sneakers in the screenshot):
- ① Topical Overview: An interactive bubble chart. Larger circles represent core topics, while smaller circles represent individual subpages, sized by search volume. You can pan, zoom, and click any bubble to open details.
- ② Strategy views:
- Best for Strategy (42 pages): High relevance, manageable KD, solid volume, non-navigational intent.
- Quick Conversions (38 pages): Commercial and transactional intent.
- More Potential Traffic (22 pages): Highest aggregate volume.
- All Pages (48 pages).
- ③ Topic and pillar page: Every topic contains one main pillar page and several supporting subpages, detailing assigned keywords, intent, KD, and search volume. For instance, the cluster “wool sneakers by fit and gender” totals 1,980 search volume with an average KD of 4.5%. Clicking Generate content next to any page passes those keywords directly to Semrush’s content writing tools.
- Add keywords in the top right lets you append terms to the strategy; 360/10,000 displays your current keyword count and project ceiling.
Step by step
- Select Seed Keyword-Based, type your primary category keyword, select your target country, and click Create.
- Allow a few minutes for the five-stage generation to complete; the Topical Overview will load once finished.
- Click into Best for Strategy to identify clusters combining low difficulty with healthy search volume.
- Expand each topic to map the recommended pillar page and subpage topics against your site’s navigation and content taxonomy.
- Under each topic, review Potential SERP competitors and content references to examine the page structures currently ranking on Google.
Less obvious features
- Click the Table tab next to Topics and pages to view all pages and keywords in a flat spreadsheet layout, which simplifies bulk filtering, review, and export.
How to use it for SEO
- When planning a site redesign or content rollout, run a seed keyword strategy to generate a pillar-and-cluster blueprint. Treat it as an initial structural draft, then refine it to align with your actual catalog.
How to use it for GEO
- AI search engines synthesize answers by pulling together multiple related questions within a topic. Covering a subject through a comprehensive pillar page backed by supporting subpages gives AI models more contextual pages to cite than an isolated article ever could.
Caveats on the data
- Clusters are derived purely from SERP keyword overlap and know nothing about your actual inventory or product catalog. Always audit the grouping manually to avoid assigning unrelated product lines to the same cluster page.
Keyword Gap: finding keywords your competitors rank for and you miss
Keyword Gap compares your keyword footprint against up to four competitors, highlighting terms they rank for that you are currently missing.
Where to find it: SEO → Competitive Analysis → Keyword Gap.
Interface and controls
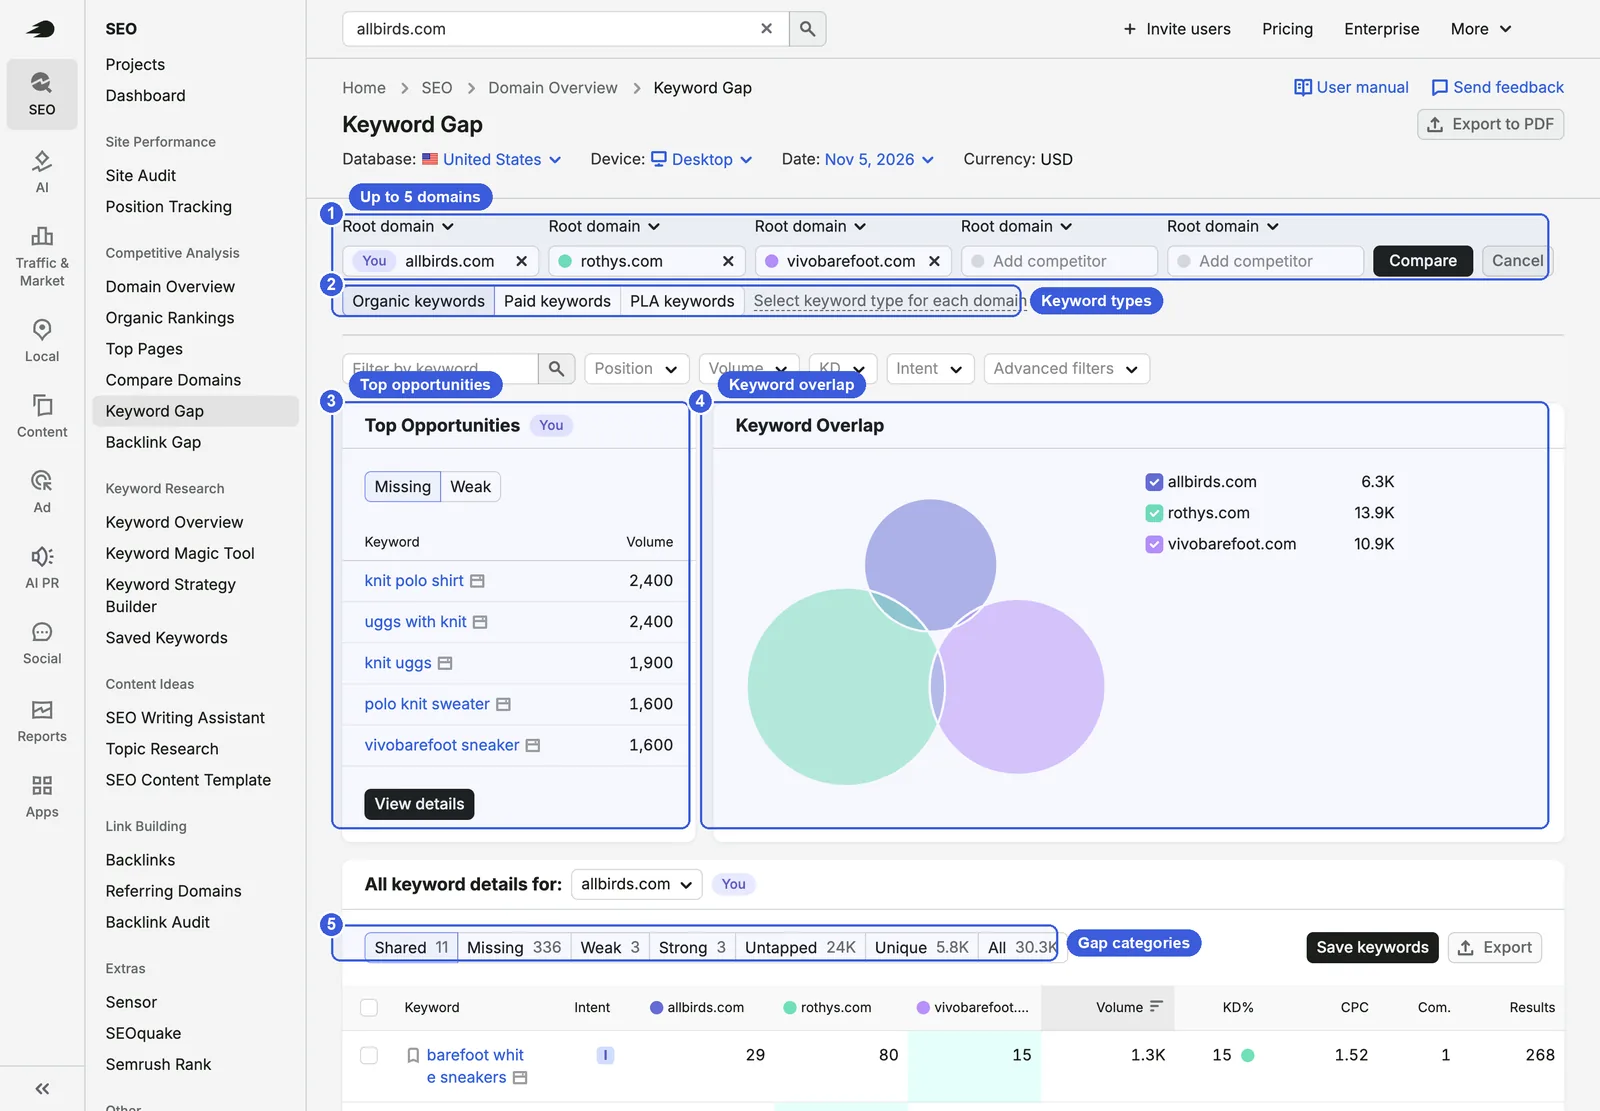
① Domains: Compare up to five domains, placing your own domain in the first field (labeled You). Use the dropdown above each entry to configure the scope: root domain, subdomain, subfolder, or exact URL. Click Compare when ready.
② Keyword types: Organic keywords, Paid keywords, and PLA keywords (shopping ads). Click Select keyword type for each domain to mix types—for example, comparing your organic rankings against a competitor’s paid search terms to uncover paid keywords where you lack organic visibility.
③ Top Opportunities: Automatically highlights high-volume terms classified as Missing and Weak. Clicking View details jumps directly into the filtered table.
④ Keyword Overlap: A Venn diagram visualizing domain overlap; circle size reflects keyword volume, while intersecting sections show shared rankings.
⑤ Gap categories: The tab bar directly above the table forms the operational core of this tool:
- Shared: Keywords where every entered domain ranks.
- Missing: Keywords where every competitor ranks, but you have no ranking.
- Weak: Keywords where you rank, but lower than every competitor.
- Strong: Keywords where you outrank all compared competitors.
- Untapped: Keywords where you do not rank, but at least one competitor does.
- Unique: Keywords where only your domain ranks.
Definitions follow the Semrush knowledge base. Numbers on each tab reflect total keyword counts; in the screenshot, allbirds.com has 336 Missing and 24K Untapped terms.
Step by step
- Place your own domain in the first box, add two or three direct rivals in the remaining boxes, set the country database, and click Compare.
- Open the Missing tab to pull queries that all your rivals rank for while you have zero presence.
- Sort the list by volume and filter for commercial or transactional intent.
- Check whether your site already has an appropriate URL for each query; if not, add those terms to your new content plan.
- Switch to the Weak tab to identify queries where you already rank on page two or three, and update those existing URLs to close the gap.
Less obvious features
- Missing represents your lowest-risk keyword opportunity: because every competitor ranks for these terms, market demand is verified and ranking is demonstrably achievable. Address high-volume Missing terms first before digging into Untapped.
- Select keyword type for each domain lets you pit your organic positions against a competitor’s paid keywords. If a rival keeps paying for a query, it usually converts well, and building an organic page for it can capture high-intent traffic without ongoing ad spend.
How to use it for SEO
- Run a Keyword Gap comparison once a quarter against three or four close competitors. Cluster the identified Missing and Weak terms by topic and fold them into your quarterly publishing calendar.
Caveats on the data
- The tool only evaluates keywords indexed within Semrush’s database.
- Keep your comparison scopes uniform across all inputs: compare root domains to root domains, or subfolders to subfolders. Mixing different scopes distorts the data.
- Compare against true peers. Adding massive general retailers like Amazon or Zappos floods the gap table with irrelevant queries and makes the report unusable.
Backlinks: checking link volume and where links really come from
The Backlinks report details a site’s backlink volume, referring domain growth, and overall backlink profile health. (Previous versions called this Backlink Analytics.)
Where to find it: SEO → Link Building → Backlinks.
Interface and controls
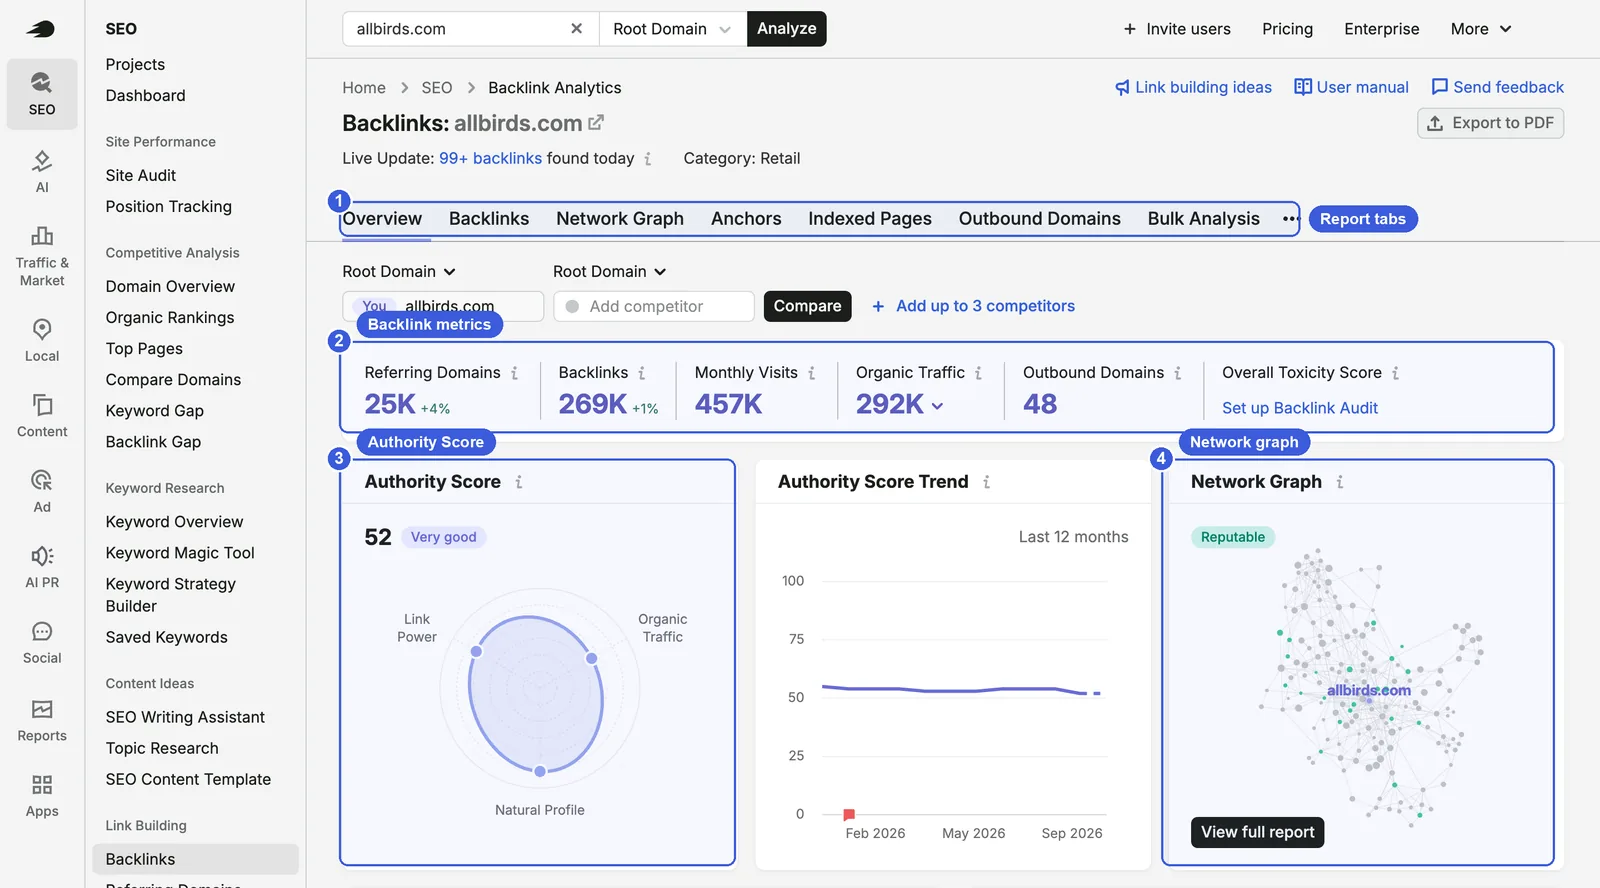
① Report tabs:
- Overview: Main summary dashboard.
- Backlinks: Individual link entries showing source URL, anchor text, and landing page.
- Network Graph: Visual map of link networks and domain relationships.
- Anchors: Breakdown of anchor text distribution.
- Indexed Pages: Pages earning the highest volume of inbound links.
- Outbound Domains: External sites that this domain links out to.
- Bulk Analysis: Audits backlink totals for multiple domains at once.
Below the tabs, you can add up to three competitors and click Compare to inspect backlink metrics side by side.
② Headline metrics: Referring Domains (25K), Backlinks (269K), Monthly Visits (457K), Organic Traffic (292K), and Outbound Domains (48). Overall Toxicity Score becomes active once you configure a Backlink Audit project.
③ Authority Score: 52 (labeled Very good). The adjacent radar chart evaluates three components:
- Link Power: Overall quantity and quality of inbound links.
- Organic Traffic: Estimated volume of organic search visits.
- Natural Profile: Indicators of an organically earned backlink profile.
If one axis is dramatically lopsided compared to the other two, that metric may be artificially skewing the composite score.
④ Network Graph: Visualizes sites linking into this domain. The Reputable badge in the top left indicates Semrush’s trust assessment of the link network; click View full report to inspect any suspicious site clusters.
Live Update under the title tracks new backlinks discovered during the current day.
Step by step
- Enter the target domain, set the scope to Root Domain, and review the Overview tab.
- Check the 12-month trend line for referring domains and backlinks to look for sudden, unnatural spikes or steep drop-offs.
- Scroll to Referring Domains by Authority Score to assess the proportion of high-authority referring domains.
- Open the Anchors tab and verify that the anchor text profile consists primarily of brand names and raw URLs, keeping exact-match commercial anchors to a modest percentage.
Less obvious features
- Enter up to three competitor domains beneath the tab bar and click Compare to evaluate referring domain growth, backlink counts, and Authority Scores across all competitors in one view.
How to use it for SEO
- Before running a link-building campaign or hiring an outreach agency, inspect your 12-month referring domain trend and anchor text distribution. Confirm there are no sudden spam spikes and that commercial exact-match anchors do not dominate your profile.
Caveats on the data
- Referring Domains is far more informative than raw Backlinks. A single sitewide footer link can register tens of thousands of backlinks while representing only one referring domain.
- The Organic Traffic figure here (292K) differs from Domain Overview (224.1K in the US database). The Backlinks report does not feature a country database selector, so its traffic estimate is global rather than US-only. When you quote a number, specify which report and database it came from.
Backlink Gap: spotting who links to your competitors but not you
Backlink Gap compares backlink profiles to show which websites link to your competitors but have not yet linked to your site.
Where to find it: SEO → Competitive Analysis → Backlink Gap.
Interface and controls
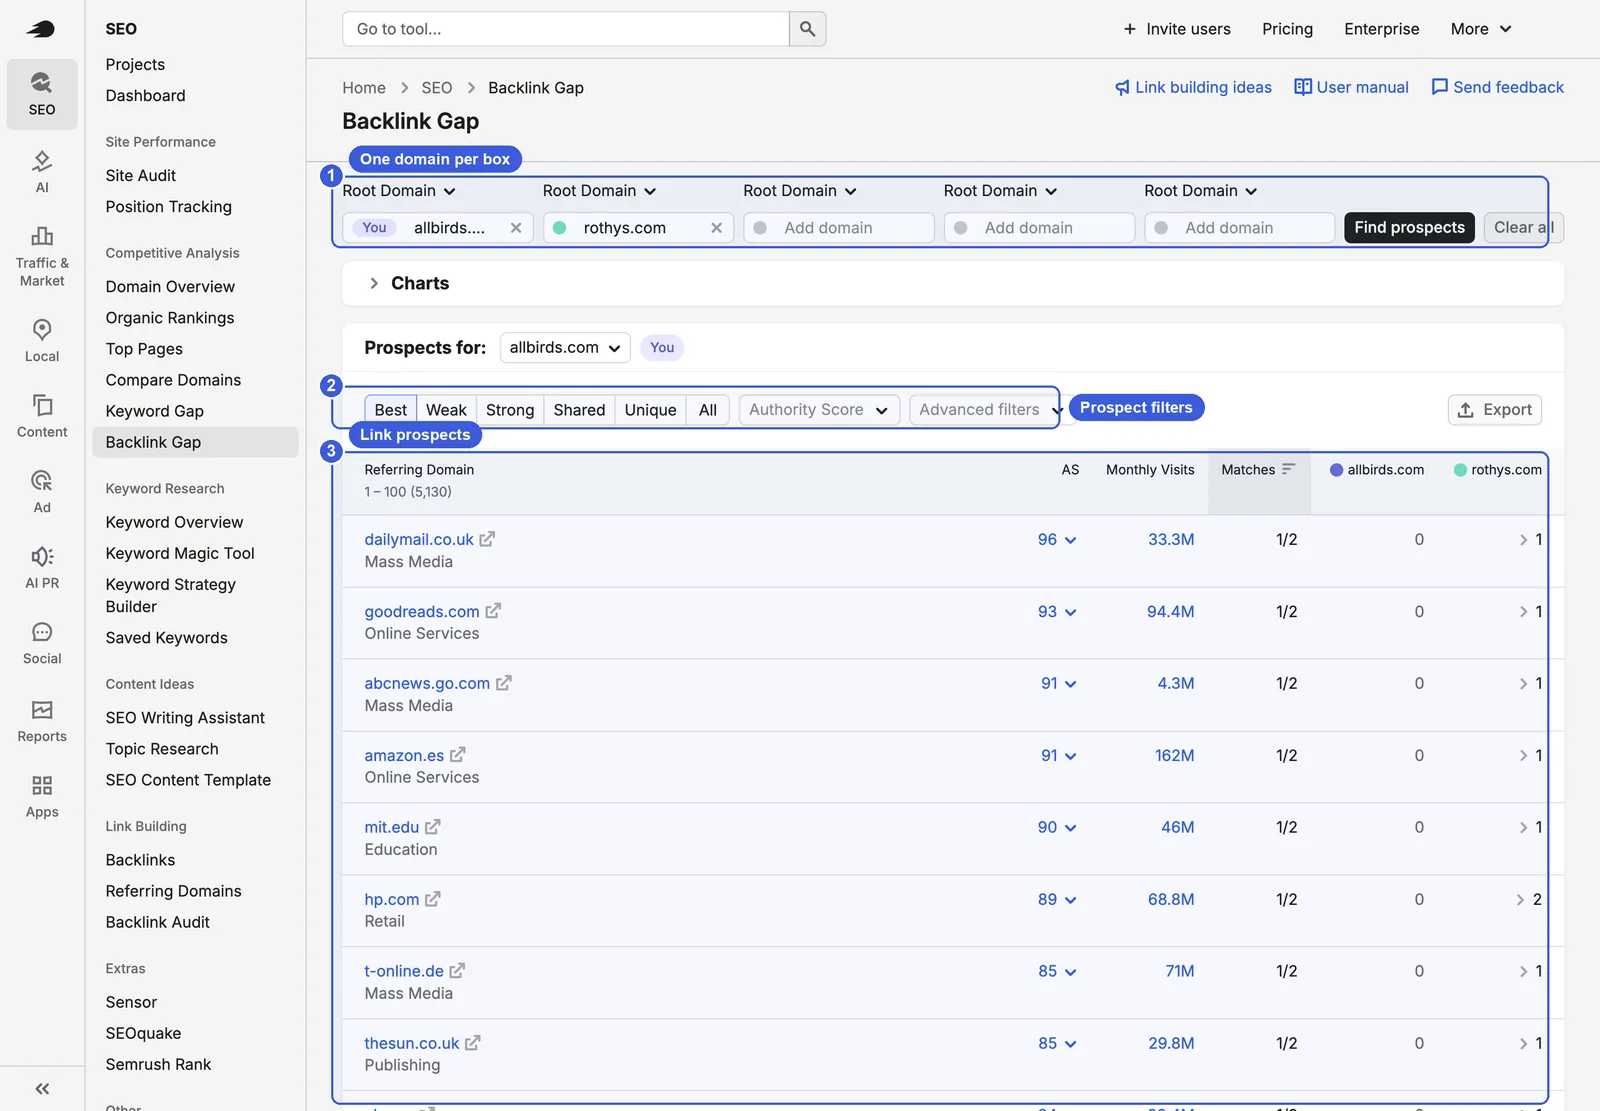
① Domains: Enter up to five domains, putting your own URL first. Enter domains one per input box and click Find prospects. Each field accepts exactly one domain; pasting multiple comma-separated URLs into a single field causes a formatting error.
② Prospect filters:
- Best: Sites linking to every competitor, but not to your site.
- Weak: Sites linking to you, but fewer times than to your competitors.
- Strong: Sites linking exclusively to you and none of the competitors.
- Shared: Sites linking to both you and your competitors.
- Unique: Sites linking to only one of the entered domains.
- All: Every referring domain captured in the comparison.
Definitions follow the Semrush knowledge base. You can also filter prospects by Authority Score and custom rules.
③ Link prospects: One referring domain per row, showing AS (Authority Score), Monthly Visits, Matches (the number of compared domains it links to), and specific link counts for each domain. The comparison between allbirds.com and rothys.com yields 5,130 prospect domains in the screenshot.
Step by step
- Place your domain in the first field, add two or three direct competitors in the other fields (one domain per box), and click Find prospects.
- The Best filter applies by default. Use the Authority Score filter to narrow results to a practical range (such as 30–70), then sort by AS or Monthly Visits.
- Skip generic aggregator platforms and national news sites; focus on industry blogs, niche publications, and product review sites.
- Click a competitor’s link count to inspect their exact linking pages and anchor text, helping you determine whether the link originated from a guest feature, product review, or PR mention.
Less obvious features
- The Matches column shows how many of your entered competitors a given domain links to. A higher match count means the site actively covers brands in your specific vertical, making it a higher-probability outreach target.
How to use it for SEO
- Select Best, sort by Authority Score, and work down the list. Major news outlets rarely add links on request, so prioritize niche blogs, review sites, and curated resource directories. If a site already features two of your competitors, they are far more likely to consider adding your brand.
Caveats on the data
- Backlink data reflects Semrush’s proprietary crawler index, which differs from Google’s internal link graph.
Site Audit: catching technical SEO issues and checking AI crawler access
Site Audit crawls your domain like a search engine to uncover technical errors, crawlability hurdles, and AI crawler access issues.
Where to find it: SEO → Site Performance → Site Audit → Create project.
Setup
- Click Create project, enter your domain (such as linusseo.com) alongside a project name, and click Create.
- Configure the audit parameters:
- General:
- Scope: Audit all subdomains or limit the crawl to a single directory.
- Limit per audit: 500 pages works well for smaller sites; set larger sites to their actual page count to avoid burning crawl quota unnecessarily.
- Pages to crawl: Follow internal links from the homepage (Website), pull URLs from the sitemap referenced in robots.txt, specify an exact sitemap URL, or upload a URL list. Pages not linked internally from the homepage will only be discovered through a sitemap.
- Schedule: Set frequency to weekly, daily, or run once manually.
- Email notification upon completion.
- Crawler: Select your user agent from SiteAuditBot Desktop, SiteAuditBot Mobile (the default), or OpenAI-Search (Googlebot is no longer an option). You can also set crawl speed and enable JavaScript rendering (JS rendering requires a Guru or Business subscription). Check the Semrush knowledge base for crawler details.
- Allow/disallow rules and URL parameter rules: Exclude utility directories and tracking parameters you do not want crawled.
- Restrictions to bypass: Configure credentials or headers for staging sites protected by login or firewall rules.
- General:
- Click Start audit. For linusseo.com (211 pages), the crawl completed in just over twenty minutes.
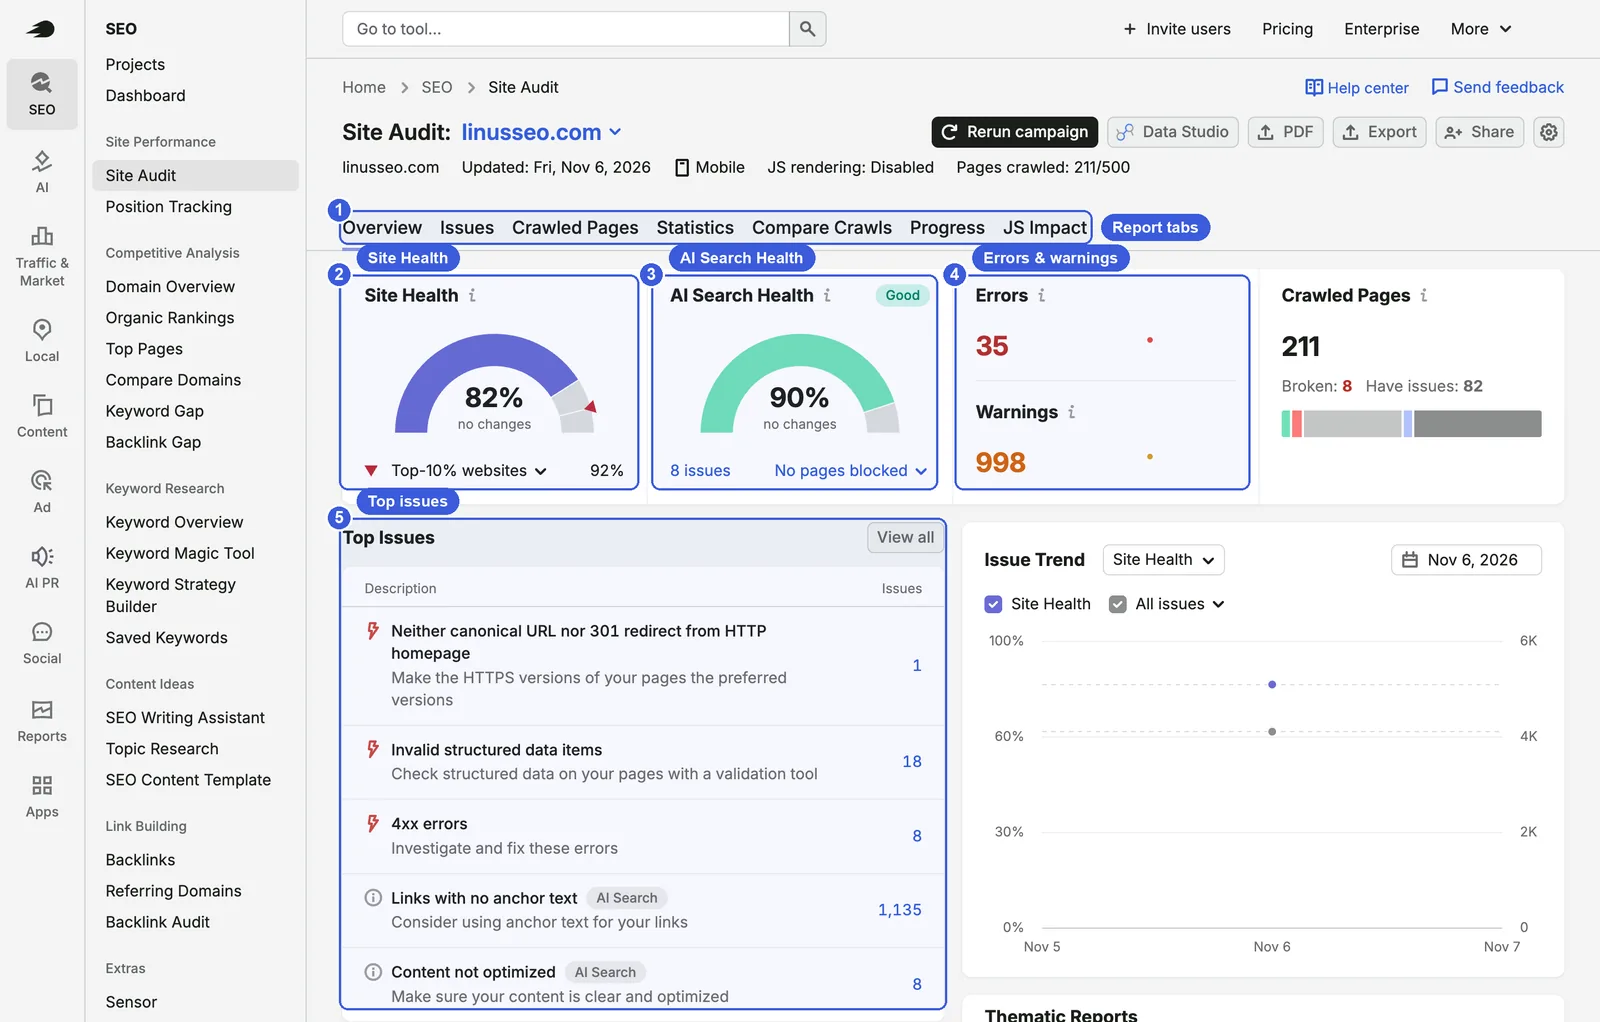
Interface and controls
① Report tabs:
- Overview and Issues.
- Crawled Pages: Page-by-page status codes and flagged items.
- Statistics: Crawl depth and technical distributions.
- Compare Crawls: Side-by-side comparison between two audit runs.
- Progress: Health trends over time.
- JS Impact: Identifies discrepancies between raw HTML and JavaScript-rendered pages.
The top summary bar displays active crawl settings (mobile, JS rendering disabled, 211/500 pages crawled in the screenshot). Rerun campaign in the upper right triggers a fresh crawl, while PDF, Export, and Share let you distribute reports.
② Site Health: 82%, calculated from the proportion of checks free of errors and warnings, benchmarked against the top 10% of audited websites (92%).
③ AI Search Health: 90% (labeled Good). Introduced in 2026, this score evaluates checks specific to AI search accessibility. “No pages blocked” confirms robots.txt is not barring AI crawlers, and “8 issues” opens the AI-specific issue list.
④ Errors and warnings: 35 errors and 998 warnings; click either number to open the filtered issue list. The panel on the right reports 211 crawled pages, with 8 broken URLs and 82 pages showing issues.
⑤ Top Issues: Prioritizes issues by severity, providing issue descriptions and counts of affected pages. In the screenshot, top items include “Neither canonical URL nor 301 redirect from HTTP homepage”, “Invalid structured data items” (18 pages), and “4xx errors” (8 pages).
Lower on the page, thematic report cards show scores for Crawlability, HTTPS, International SEO (hreflang), Site Performance, Internal Linking, Markups (schema), and Core Web Vitals.
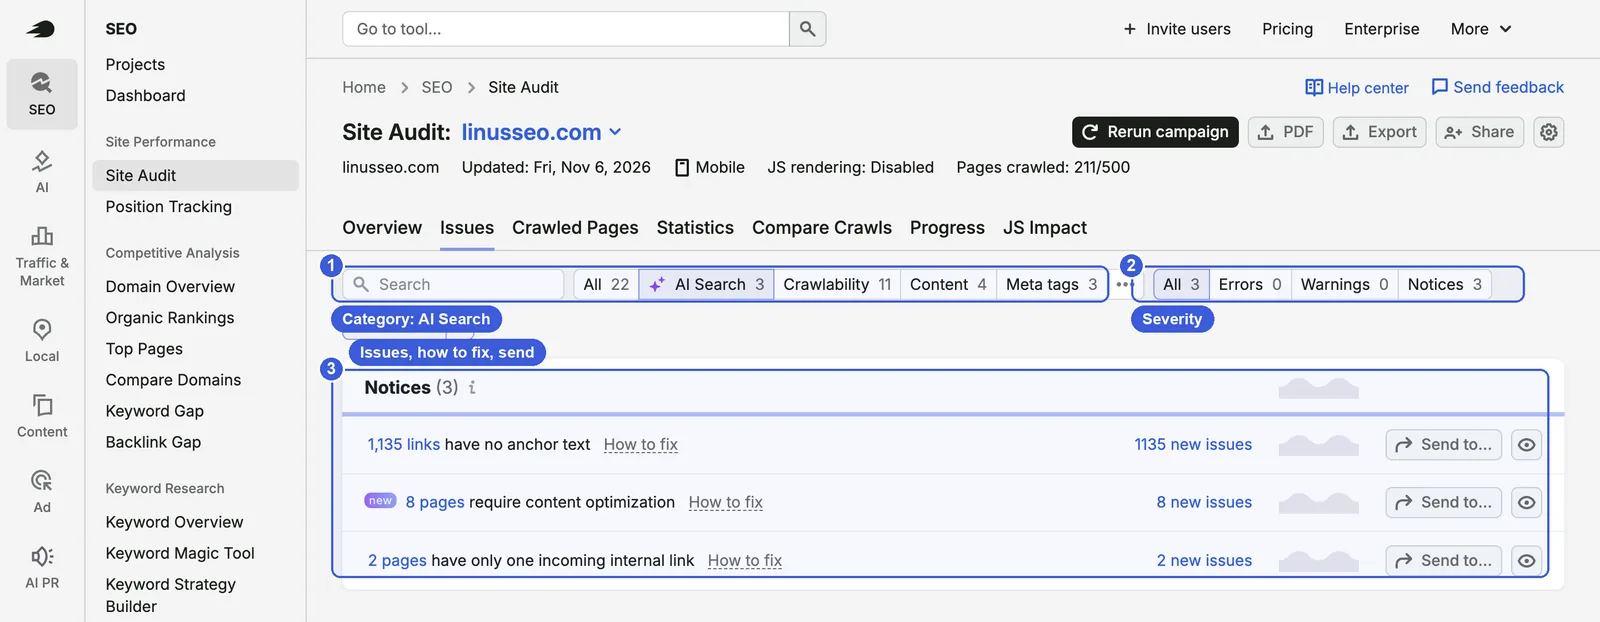
On the Issues tab:
- ① Category: Filter by All, AI Search, Crawlability, Content, Meta tags, and others. The screenshot shows AI Search selected.
- ② Severity: Filter across Errors, Warnings, and Notices. The “With issues” toggle isolates checks that flagged problems.
- ③ Issue list: Each item includes a How to fix link detailing Semrush’s recommended fix, alongside a Send to… button to dispatch tickets to task managers. The three AI Search notices in the screenshot highlight 1,135 links without anchor text, 8 pages requiring content optimization, and 2 pages with only a single incoming internal link.
Step by step
- Once an audit finishes, address items under Top Issues first, prioritizing 4xx broken links, redirect loops, and schema syntax errors.
- After running multiple audits, use Compare Crawls to see whether recent code releases introduced new technical bugs.
- Open the Issues tab, filter by category (such as AI Search or Crawlability), and export the action items for your developers.
Less obvious features
- Run a secondary audit with the crawler user agent switched to OpenAI-Search to see how ChatGPT’s search bot navigates your site and where it hits obstacles.
- If you enable JS rendering, the JS Impact tab isolates links and content that only render after JavaScript executes. Crawlers that do not execute client-side JS will miss this content entirely.
How to use it for SEO
- Always run an audit before and after website redesigns, CMS updates, or domain migrations. Use Compare Crawls to verify that no fresh 4xx errors, broken redirect chains, or canonical conflicts were introduced.
- Fix hard errors first, followed by warnings affecting high volumes of templates. Notices represent advisory best practices; reaching zero notices is rarely necessary.
How to use it for GEO
- Check AI Search Health and confirm the “No pages blocked” status to ensure your robots.txt or CDN firewall is not blocking crawlers like GPTBot, ClaudeBot, and PerplexityBot.
- Filter issues by the AI Search category and audit your content structure, schema completeness, and internal linking paths.
Taking the audit on this site as an example, the bare domain’s 302 temporary redirect is a real issue to fix first, and each of the eight 4xx URLs needs checking for deleted or moved pages, whereas the HTTP homepage error is simply the crawler flagging a 308 permanent redirect because it only checks for 301. In addition, hreflang language mismatch warnings triggered by English technical terms on bilingual pages are common false alarms; check them page by page, and most can be ignored.
Caveats on the data
- Core Web Vitals showed 0% in the thematic dashboard at capture time. That audit score reflects only synthetic snapshots taken during crawling and does not represent actual field user experience. For reliable site speed metrics, refer to the Core Web Vitals report in GSC (derived from real Chrome user data) and PageSpeed Insights.
Position Tracking: monitoring daily rankings in Google and AI search
Position Tracking monitors your chosen target keywords on a daily schedule. Unlike Organic Rankings, this tool updates daily and allows you to track specific cities, devices, and AI platforms.
Where to find it: SEO → Site Performance → Position Tracking. Choose a project and click Set up.
Setup
- Targeting:
- Search engine: Choose Google, ChatGPT, or Gemini; clicking “…” reveals additional options. Choosing ChatGPT or Gemini monitors how your brand surfaces in AI answers.
- Device: Desktop, Mobile, or Tablet.
- Location and language: Pinpoint locations down to city or postal code level.
- Business name for local map pack: Optional setting for tracking Google Map local pack visibility.
- Click Continue To Keywords and add search terms: enter them manually (one per line), paste them with custom tags, or click Import from… to pull terms from existing reports. Click Add keywords to campaign, then Start Tracking.
- Initial data collection takes some time. For the 10 keywords tracked on linusseo.com, processing took roughly an hour, during which the interface displays “Gathering keywords data”.
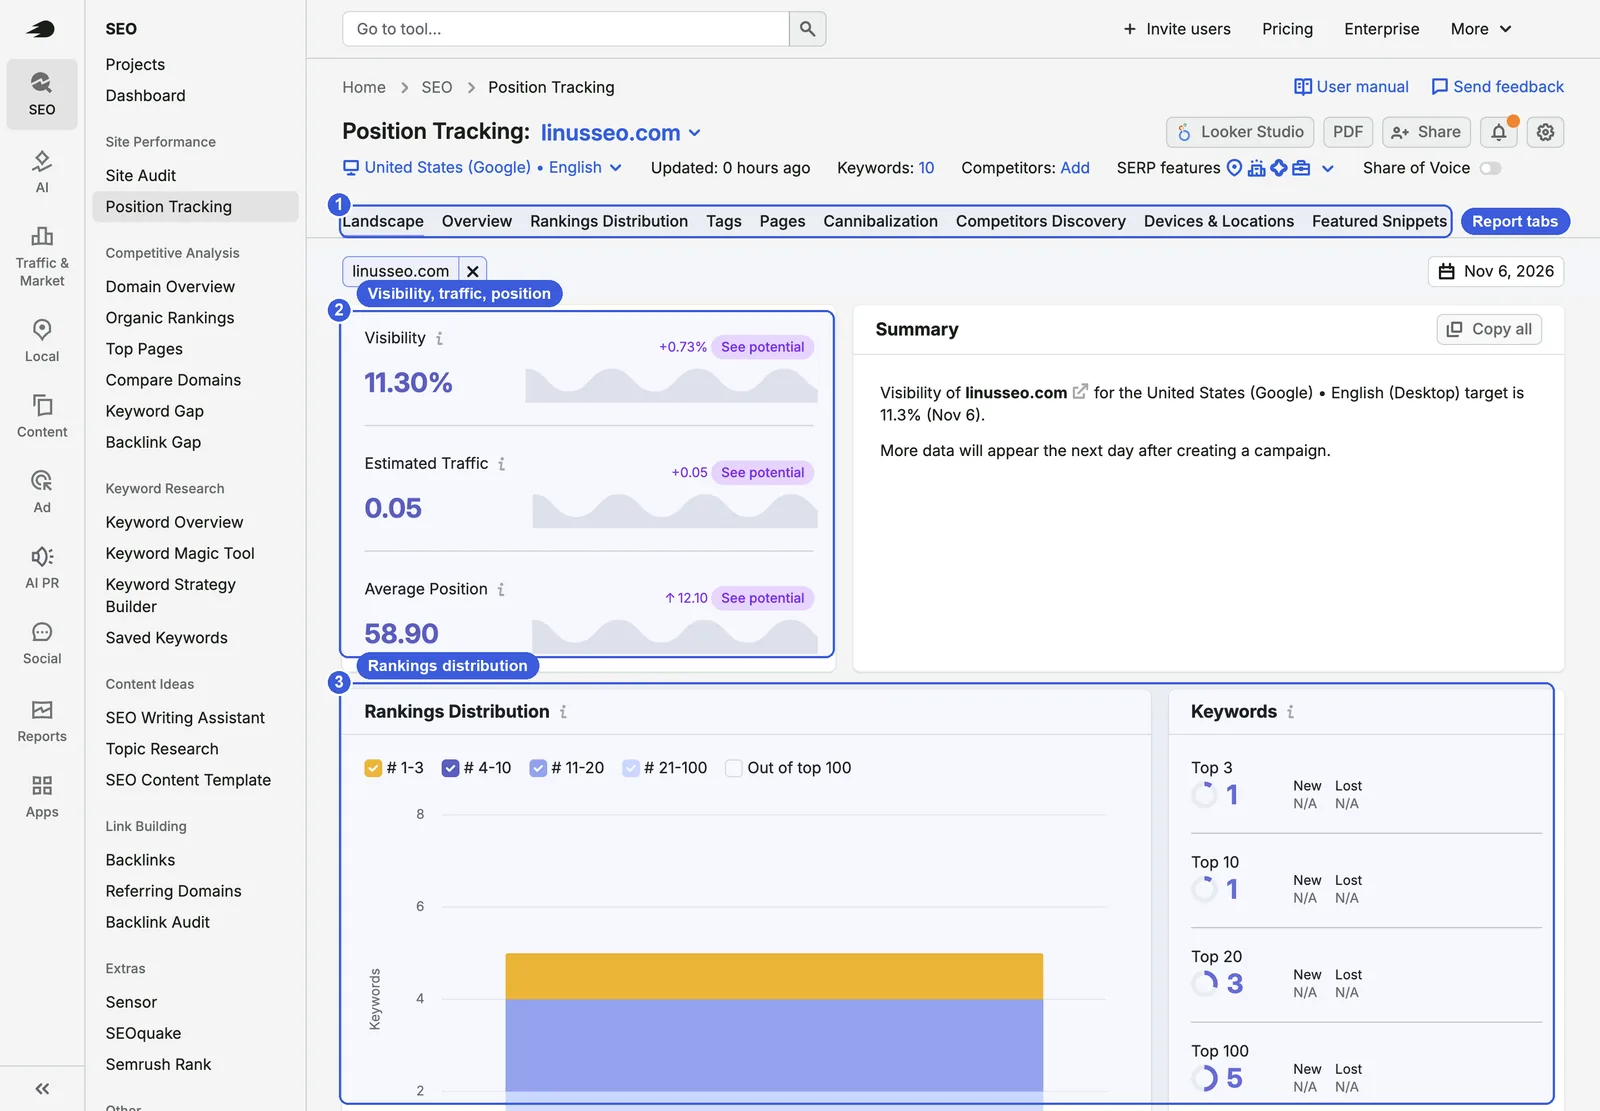
Interface and controls
The header bar details your tracking profile (United States (Google) • English), last update timestamp, keyword volume, competitor tracking shortcuts (click Add to include rivals), SERP feature icons, and a Share of Voice toggle. The top right integrates with Looker Studio, PDF export, and sharing.
① Report tabs:
- Landscape: Executive summary overview.
- Overview: Full keyword ranking table (your primary daily workspace).
- Rankings Distribution, Tags, and Pages: Metrics grouped by position tiers, custom tags, and landing URLs.
- Cannibalization: Flags instances where multiple URLs on your site compete for the same query.
- Competitors Discovery: Surfaces domains competing against you on tracked queries automatically.
- Devices & Locations and Featured Snippets: Compares cross-device performance and tracks featured snippet ownership.
② Headline metrics:
- Visibility: A percentage metric modeled from ranking positions and estimated click-through rates (11.30% for linusseo.com).
- Estimated Traffic: 0.05.
- Average Position: 58.90.
Clicking See potential next to each metric estimates potential performance gains if rankings improve.
③ Rankings Distribution: Left chart displays keyword counts across ranking brackets; right panel tracks counts in top 3, top 10, top 20, and top 100, alongside new and lost tallies. At capture time, linusseo.com had 1 keyword in top 3, 3 in top 20, and 5 in top 100. New and lost comparison metrics appear starting from day two.
Step by step
- Following setup, assign tags to keywords based on product lines or content categories.
- Click Add next to Competitors and enter two or three direct market peers.
- Check the Overview tab weekly to review search terms experiencing significant position swings.
- Open the Cannibalization tab to verify that two of your own URLs are not splitting rankings on the same search term.
Less obvious features
- Turn on the Share of Voice toggle beneath the project title to track your market visibility share against rivals across your core target keywords.
- Use the Cannibalization tab to detect internal keyword competition. When two pages battle for one keyword, either consolidate the content into one definitive page or adjust internal links to signal which URL should rank.
How to use it for SEO
- Populate Position Tracking with your primary revenue and category terms, tagging them by product collection. Review gains and losses weekly, paying closest attention to keywords that dropped out of the top ten.
- Track two or three close competitors to catch when a rival begins overtaking your rankings on key commercial terms.
How to use it for GEO
- Track identical question-based keywords simultaneously in Google and ChatGPT to observe how your brand’s presence differs between traditional organic search and conversational AI answers.
Caveats on the data
- Rankings update once every 24 hours based on Semrush’s scheduled query scrapes for the configured location and device. Local searches run on personal devices reflect personalized history and exact geolocations, so minor variations from report data are normal.
AI Visibility: tracking how AI answers mention and cite your brand
The AI Visibility toolkit monitors how frequently platforms like ChatGPT, Google AI Overview, AI Mode, and Gemini mention your brand and cite your web pages in generative answers.
Where to find it: Click AI on the far-left rail to enter Visibility Overview.
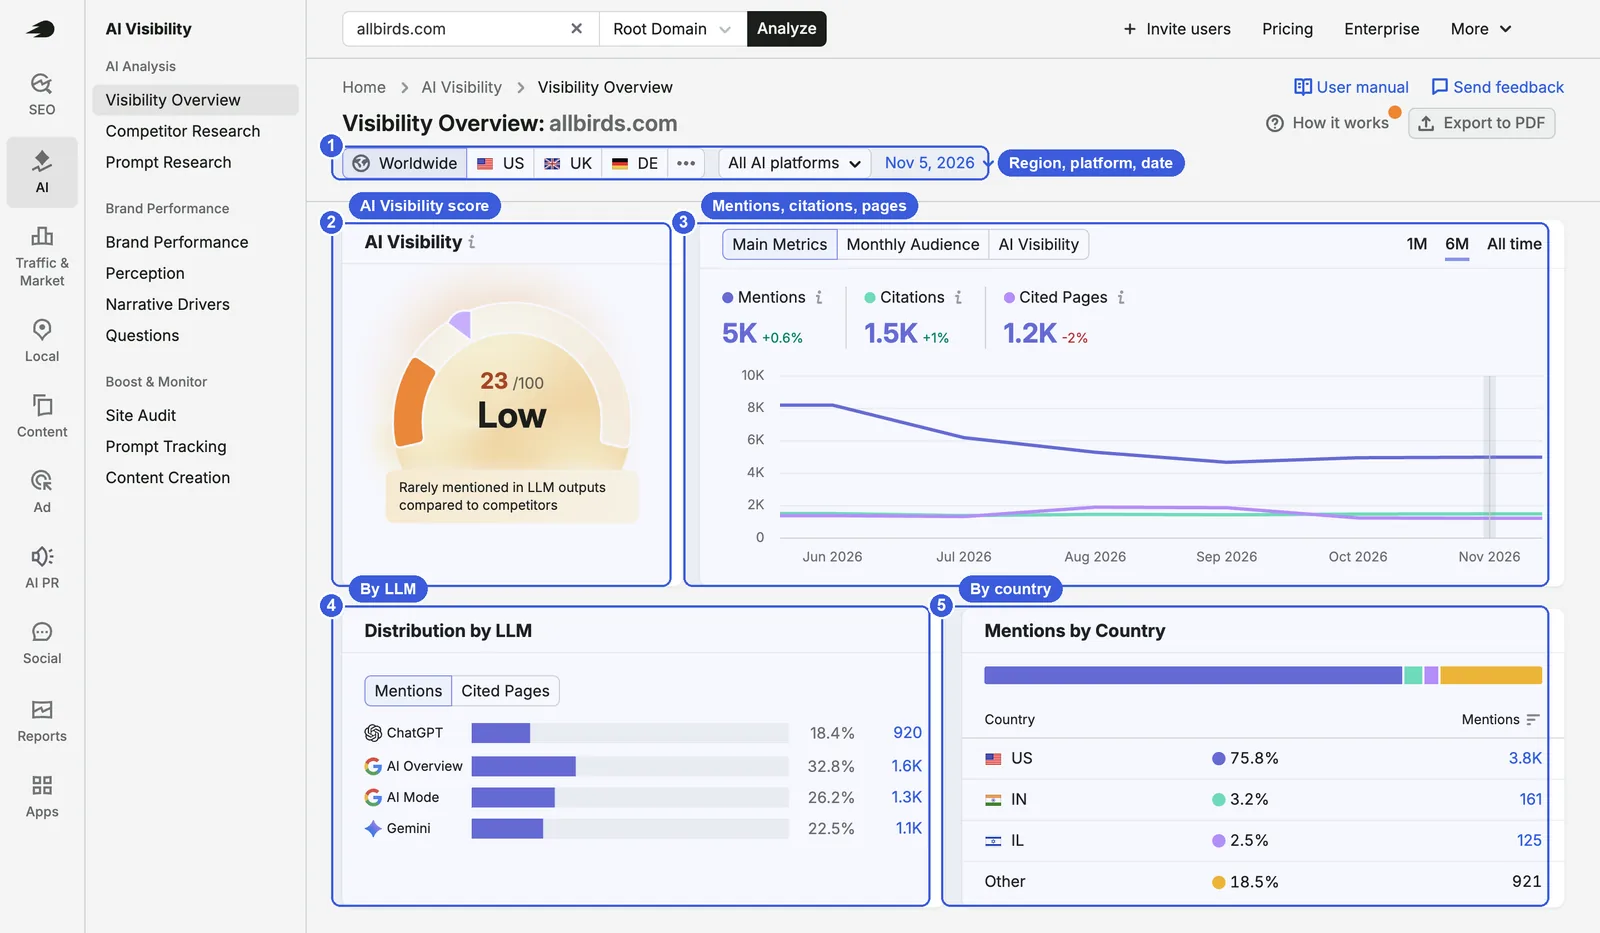
Interface and controls
① Region, platform and date: Select Worldwide or filter by individual country; use the All AI platforms dropdown to focus on a single model; select historical dates.
② AI Visibility score: Scaled 0–100. allbirds.com scores 23 Worldwide (labeled Low, with the assessment “Rarely mentioned in LLM outputs compared to competitors”).
③ Main Metrics:
- Mentions (5K): Total instances where AI answers mention the brand name.
- Citations (1.5K): Total instances where AI responses link back to the brand’s site.
- Cited Pages (1.2K): Total unique URLs referenced as sources.
Toggle to Monthly Audience to review estimated audience reach.
④ Distribution by LLM: Share of brand mentions across platforms: ChatGPT 18.4%, AI Overview 32.8%, AI Mode 26.2%, and Gemini 22.5%. You can switch the view between Mentions and Cited Pages.
⑤ Mentions by Country: Geographic breakdown, with the US accounting for 75.8%, followed by India at 3.2% and Israel at 2.5%.
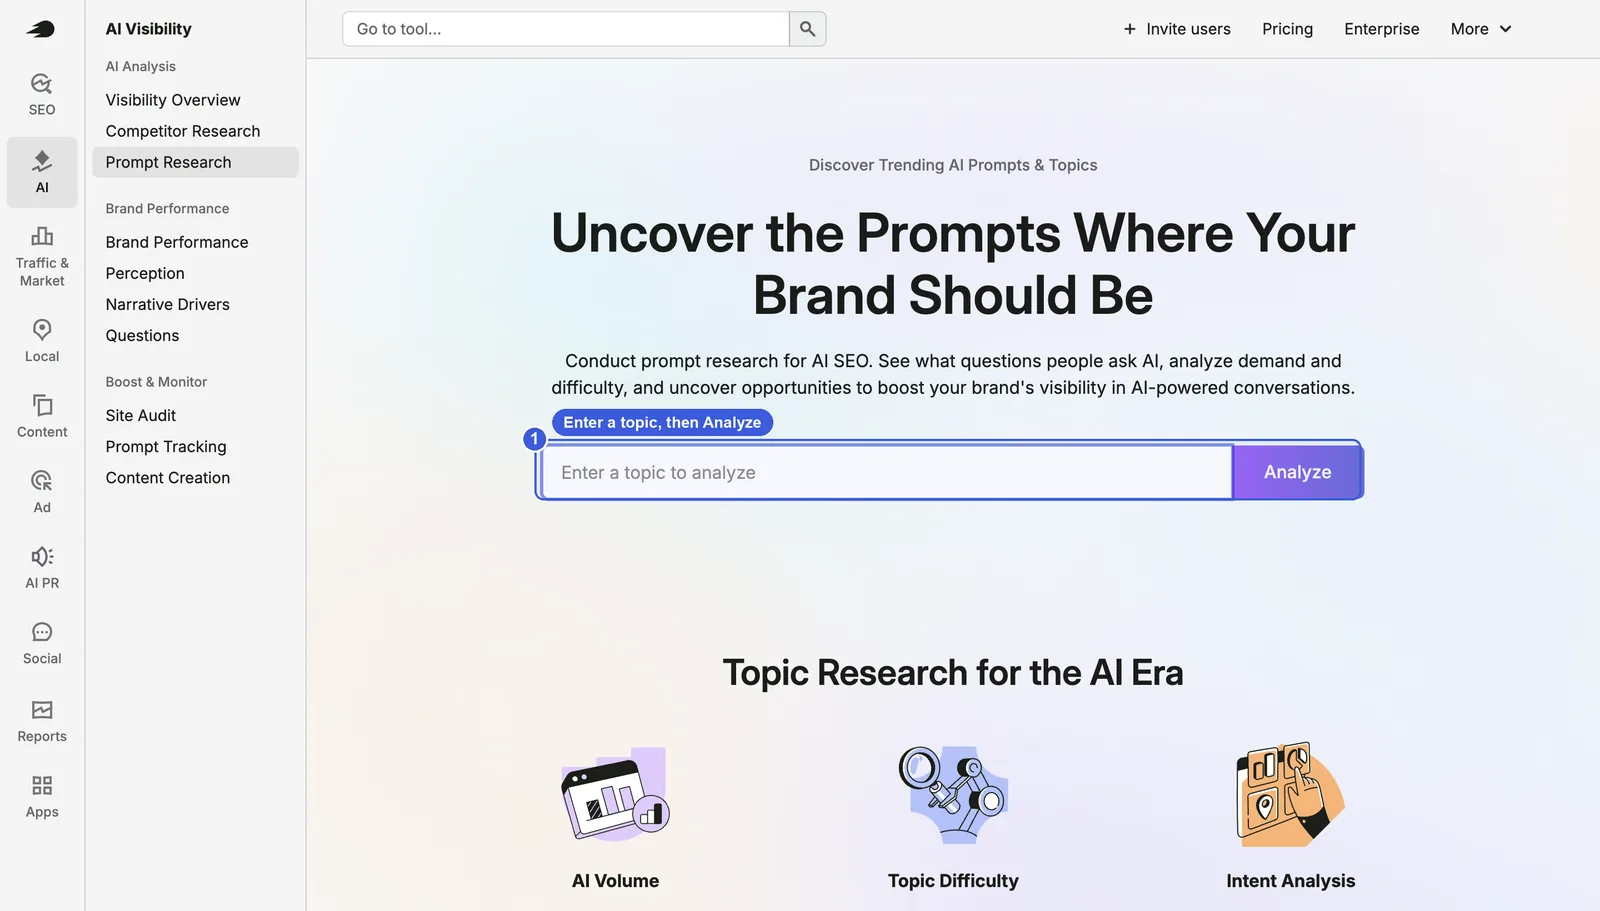
Additional modules in the left sidebar:
- AI Analysis:
- Visibility Overview (this current view).
- Competitor Research: Direct AI visibility comparisons against competitors.
- Prompt Research: Enter a topic to review how users query AI models, search volumes, and ranking difficulty.
- Brand Performance:
- Brand Performance.
- Perception: How AI models describe and characterize your brand.
- Narrative Drivers: The web sources shaping that description.
- Questions.
- Boost & Monitor:
- Site Audit: Links to the same technical audit tool found in the SEO toolkit.
- Prompt Tracking: The ChatGPT and Gemini tracking module within Position Tracking.
- Content Creation.
Less obvious features
- Inside Distribution by LLM, toggle from Mentions to Cited Pages to see how many unique URLs each platform links to. If an engine delivers high mentions but low cited pages, the model knows who you are but does not use your site as a factual reference.
Step by step
- Click AI in the left navigation and enter your brand’s root domain.
- Review your composite AI Visibility score and the three core metrics: Mentions, Citations, and Cited Pages.
- Check Distribution by LLM to spot which platforms underrepresent your brand.
- Scroll down to Your Performing Topics to see which product categories AI connects with your domain.
Plan limits: The account used for these screenshots can access Visibility Overview, but running Competitor Research or Prompt Research requires an upgrade to Semrush One. Availability of these two modules depends on your subscription tier.
How to use it for GEO
- Log AI Visibility, Mentions, and Citations once a month for your site alongside two or three competitors. The absolute score matters less than your trajectory relative to competitors.
- High mentions with low citations indicate that AI models recognize your brand entity but do not treat your domain as an authoritative source. Build citation-friendly content assets: detailed spec comparison tables, comprehensive sizing guides, and material teardowns that answer specific factual questions directly.
- When one specific engine lags behind in Distribution by LLM, troubleshoot that platform individually. If AI Overview visibility is weak, focus on your core Google organic rankings; if ChatGPT lags, check Bing indexation and brand mentions across third-party media and forums.
Caveats on the data
- Generative responses vary based on context and user history. Semrush evaluates performance across a structured, sampled set of category prompts; view the data as a directional benchmark and relative comparison rather than an exhaustive tally. Semrush does not publish the exact prompt list used for each industry.
Putting it together: a practical daily and monthly routine
| Frequency | Task | Modules |
|---|---|---|
| Weekly | Core keyword rankings and sudden drops | Position Tracking, Position Changes |
| Weekly | Diagnosis after algorithm updates | Position Changes, Domain Overview Notes |
| Monthly | Competitor content moves | Top Pages (New), Organic Rankings |
| Monthly | AI visibility log | AI Visibility Overview, Top Pages (LLM Prompts) |
| Monthly | Technical check | Site Audit (weekly for large sites) |
| Quarterly | Keyword and backlink gaps | Keyword Gap, Backlink Gap |
| New project | Competitor benchmark and keyword list | Domain Overview, Keyword Magic Tool, Keyword Strategy Builder |
In practice, adjust this cadence to match your site’s scale and publishing frequency. For smaller sites with stable content, there is no need to run every module weekly; I recommend focusing primarily on tracking core keyword rankings and diagnosing movements after algorithm updates, while secondary tools such as the content and strategy modules can be used far less frequently if you already have an established editorial workflow.
How far can you trust Semrush data?
Semrush calculates its metrics by crawling Google search results against its proprietary keyword database, then estimates traffic using standard CTR models. Keep these boundaries in mind:
- What it is great for: Evaluating relative performance against competitors, tracking directional trends, and discovering keyword and backlink opportunities.
- What it is not for: Treating traffic estimates as actual visit counts, or using Semrush numbers to set internal business KPIs. For true clicks and impressions, rely on GSC; for sessions and conversion tracking, rely on GA4.
In late October 2026, Google altered how it handles automated search requests. Both Semrush and DataForSEO confirmed their data scraping was affected, leading to temporary drops in indexed keyword counts and traffic estimates across third-party SEO platforms. The keyword trend line for allbirds.com in the screenshots shows a noticeable dip through late 2026, which may partly reflect this data collection shift. Jindouyun SEO explains how to verify it (in Chinese).
For practitioners: checking Semrush estimates against GSC
- In Semrush Organic Rankings, export your domain’s keywords and estimated traffic for your target country database.
- In Google Search Console’s Performance report, filter by the same country and export queries and clicks across the identical timeframe.
- Merge the datasets on keyword to evaluate three patterns: keywords Semrush records as ranking where GSC shows zero impressions (database discrepancy), keywords showing rank discrepancies greater than five positions (scraping timing or regional geolocation variance), and the ratio between total GSC clicks and Semrush estimated traffic.
- That ratio typically remains relatively consistent for a given site. Once you know your site’s ratio, you can apply that mental adjustment factor when reviewing competitor traffic estimates.
Keep in mind that this ratio varies significantly across different sites, so you should never rely on an arbitrary industry-wide multiplier. What matters most is monitoring the stability of your own site’s ratio over time; a sudden shift usually indicates that an algorithm update reshuffled your rankings or that the site gained traffic from long-tail queries missing from third-party databases.
FAQ
Does Semrush have a Chinese interface?
Yes. You can switch the interface language in the website footer, which redirects to zh.semrush.com. The language preference saves at the account level; if your team shares a single login, switching languages changes the display for everyone using that account.
Semrush or Ahrefs?
Both platforms handle the core demands of an ecommerce website: domain diagnostics, keyword discovery, backlink profiling, and site crawling. Semrush offers broader coverage across PPC, local search, social tools, and AI search tracking. I recommend testing both tools on the same group of competitors to see which database has deeper coverage for your specific niche.
How much can you do on the free plan?
Without logging in or on a free registration, you receive only a handful of daily searches, and reports truncate to the first few rows. When opening reports while logged out, Semrush currently offers 10 free requests upon registering an account. For regular SEO work, you will need a paid subscription.
Why does Semrush traffic differ so much from my analytics?
Semrush traffic is a modeled estimate derived from public rankings and search volumes. It cannot track direct traffic, email campaigns, referral links, or paid ads, and it misses long-tail searches absent from its keyword database. Even comparing organic Google traffic alone, the gap between estimates and reality is often substantial. Always rely on GSC for accurate traffic data.
What counts as a good AI Visibility score?
Semrush does not establish an absolute universal benchmark. The score is designed for relative comparison against competitors in your vertical and for tracking your own brand’s progress over time. allbirds.com scores 23 (Low) Worldwide, but reaches 69 within the US database alone. Always verify that you are comparing scores within the exact same region.
Semrush Tutorial: The Complete Guide (2026)